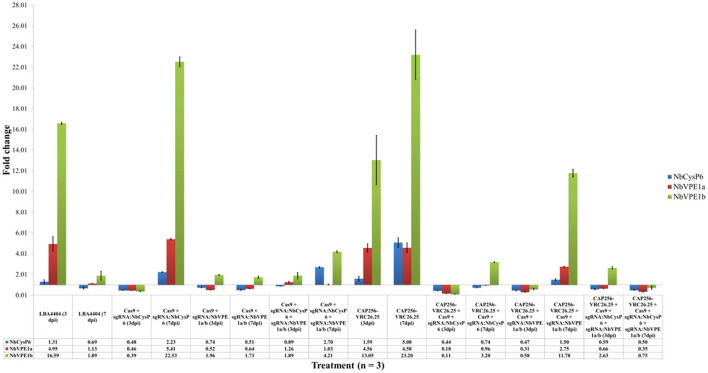
Figure 2.
Fold change in the expression of NbCysP6, NbVPE1a and NbVPE1b. Fluctuations in gene expression of NbCysP6 (blue), NbVPE1a (maroon), and NbVPE1a (green) under all tested conditions were analyzed by RT-qPCR. Error bars indicate standard error of the mean (SEM) for three biological replicates. The table indicates the fold change in the expression of NbCysP6, NbVPE1a, and NbVPE1b on three dpi and seven dpi. Experimental groups were normalized to reference genes and related to the uninfiltrated control set at one.

