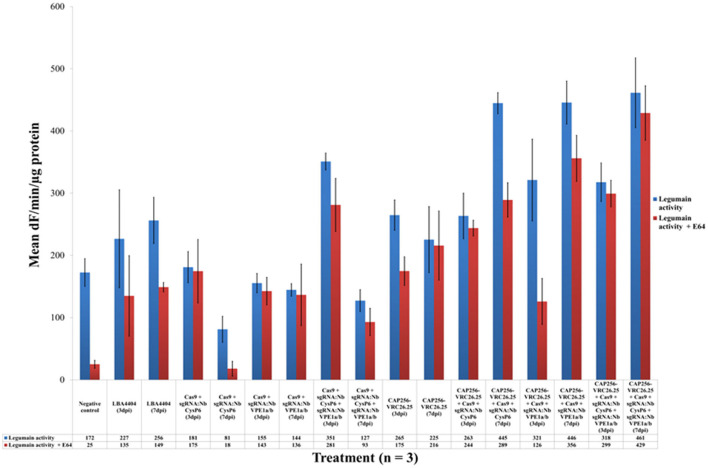
Figure 6.
Legumain protease activities of leaf samples with and without genome editing mediated disruption of proteases. Three dpi samples are in blue whereas seven dpi samples are in maroon. The y-axis represents the mean activities expressed as fluorescence units (dF) per min per μg protein. Mean activities of three biological replicates are shown within bars. Error bars indicate standard error of the mean (SEM).

