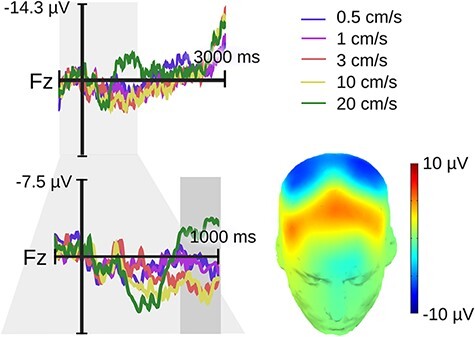
Fig. 2.

Experiment 1 (hairy skin) late positive velocity effect over a frontal midline region. The upper electrode shows the original epochs lasting up to 3 s following touch onset. The lower electrode shows the re-epoched data lasting up to 1 s following touch onset. The gray rectangle highlights our window for statistical analysis ranging from 0.7 to 1 s. No modulation was seen after this time window. The topography of the velocity effect (3 cm/s minus 20 cm/s) is printed on a 3D head.
