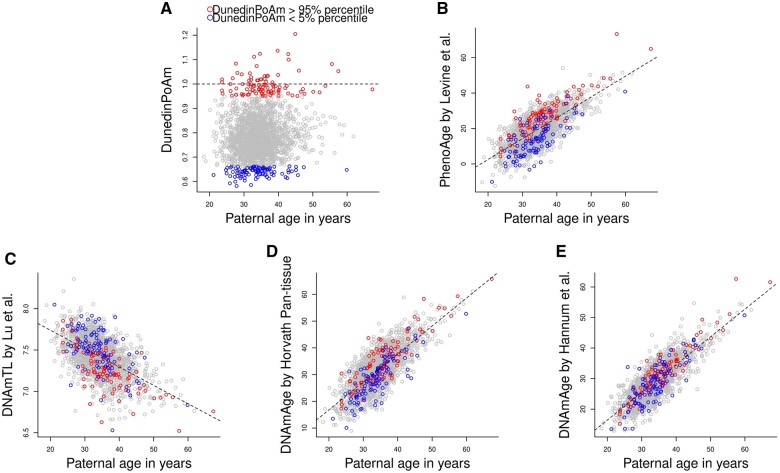
Figure 3.
Scatter plots of paternal age at blood sampling against paternal biomarkers of aging. (A) DNAm-estimated ‘Pace of Aging’ (referred to as DunedinPoAm) by Belsky et al. (2020), (B) PhenoAge by Levine et al. (2018), (C) DNAm-estimated telomere length (DNAmTL) by Lu et al. (2019), (D) DNAmAge by Horvath (2013) and (E) DNAmAge by Hannum et al. (2013). The red dots refer to the fathers with 95% percentile of DunedinPoAm, while the blue dots refer to the fathers with 5% percentile of DunedimPoAm. The dotted line indicates the linear regression of each biomarker of aging on paternal age at blood sampling. DNAm, DNA methylation; PhenoAge, DNAm-estimated phenotypic age; DNAmTL, DNAm-estimated telomere length; DNAmAge, DNA methylation age.

