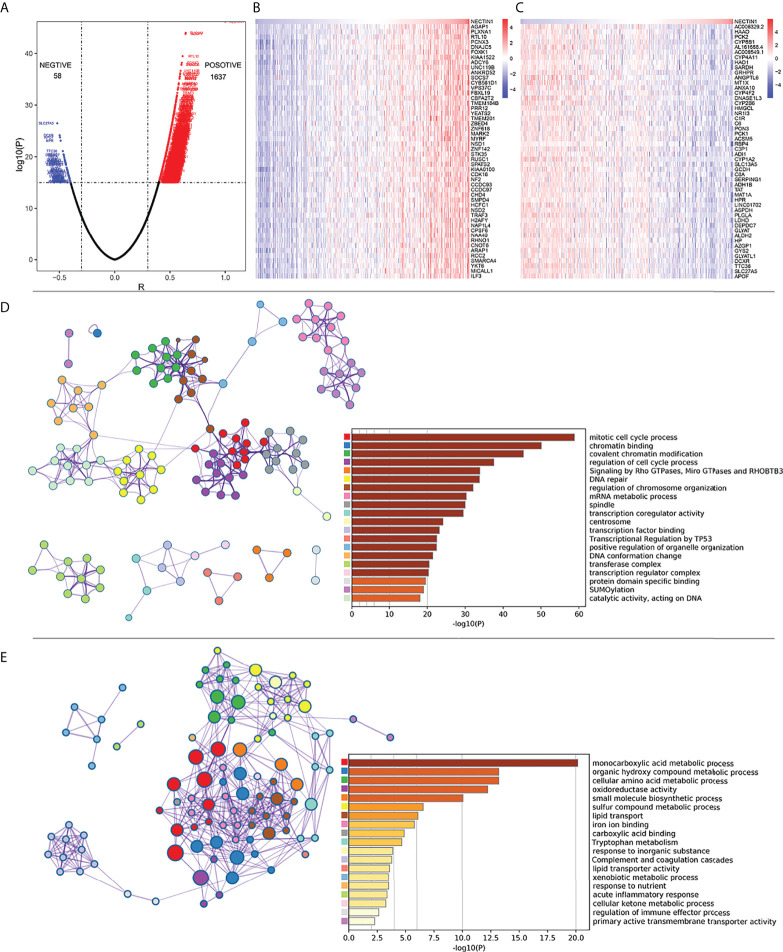
Figure 5.
Correlation analysis of coexpressed genes between nectin-1 and HCC tissues. (A) Volcano diagram of nectin-1 and coexpressed gene. (B) Analysis of the 50 most positively correlated coexpression genes of nectin-1. (C) Analysis of 50 most negatively correlated coexpression genes of nectin-1. (D) Gene functional enrichment analysis of nectin-1 positively related genes by Metascape. (E) Gene functional enrichment analysis of nectin-1-negative correlation gene by Metascape.

