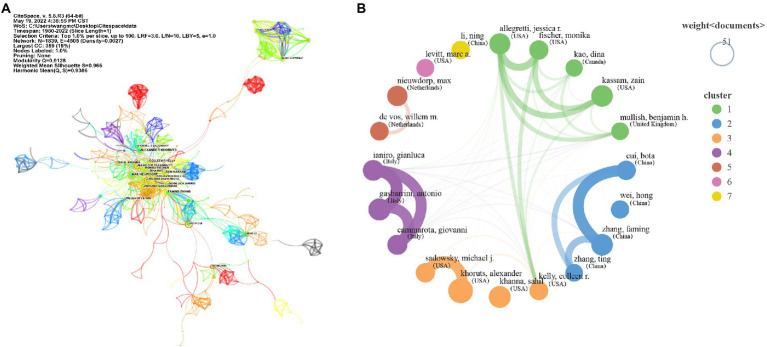
Figure 5.
Distribution and Co-authorship analysis of authors. (A) The collaborations among the main authors and their teams on FMT. Each dot or circle represents an author, authors with the same color may be from the same research team; the line between them represents a collaborative relationship, and the width of the lines represents the strength of their cooperation. (B) The cooperative relationships of the top 20 authors with each other. The size of the circle represents the number of publications of different authors; the width of the lines between different authors represents the strength of their cooperation; authors with the same color may be from the same research team.

