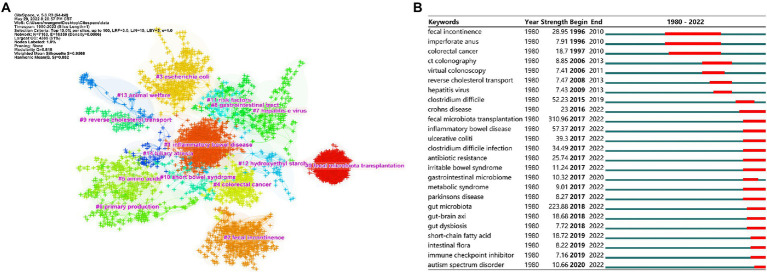
Figure 8.
Keyword co-occurrence analysis. (A) The top 15 clusters of keywords. Each cross represents a keyword, and crosses with the same colors represent a cluster with the same topic. (B) The top 25 keywords with the strongest citation bursts. The “Strength” represents the strength of citation bursts, the strength value is proportional to the bursts. It also represents the important value of the keyword.

