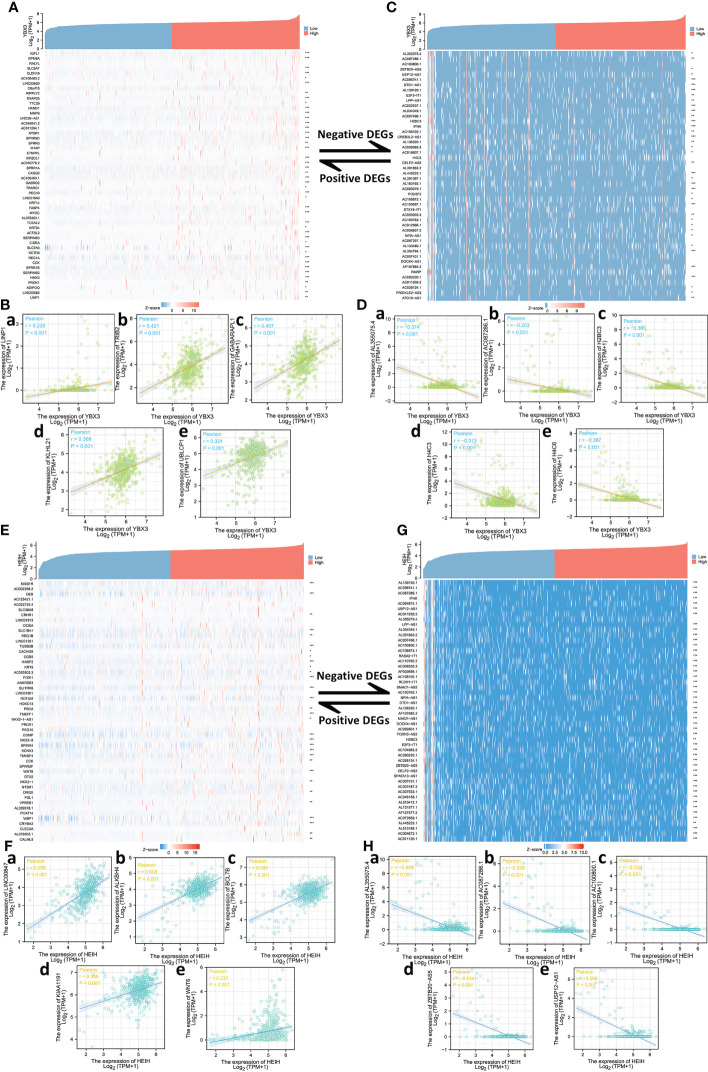
Figure 3.
Top 50 genes correlated with YBX3 and HEIH expression in colon adenocarcinoma (COAD). (A) Gene co-expression heat map of the top 50 genes positively correlated with YBX3 in COAD. (B, a–e) Correlation analysis of the top five genes and YBX3 expression of COAD (positively correlated). (C) Gene co-expression heat map of the top 50 genes negatively correlated with YBX3 in COAD. (D, a–e) Correlation analysis of the top five genes and YBX3 expression of COAD (negatively correlated). (E) Gene co-expression heat map of the top 50 genes positively correlated with HEIH in COAD. (F, a–e) Correlation analysis of the top five genes and HEIH expression of COAD (positively correlated). (G) Gene co-expression heat map of the top 50 genes negatively correlated with HEIH in COAD. (H, a–e) Correlation analysis of the top five genes and HEIH expression of COAD (negatively correlated).

