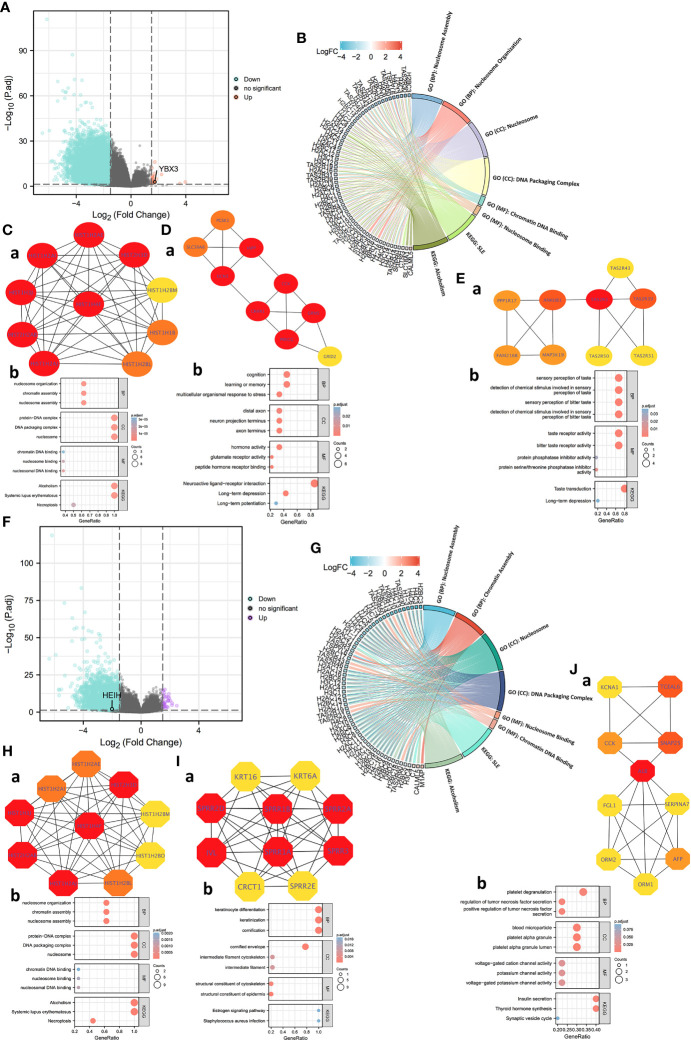
Figure 4.
Protein–protein interaction (PPI) network construction and Gene Ontology (GO) and Kyoto Encyclopedia of Genes and Genomes (KEGG) analyses of differentially expressed genes (DEGs) between HEIH/YBX3 high-expression and low-expression groups in COAD. (A) Volcano map of DEGs of HEIH expression in COAD (red: upregulation; blue: downregulation). (B) GO and KEGG pathway enrichment analyses of DEGs of HEIH in the form of a chordal graph. (C, a) Hub genes of PPI network (ranking first) and MCODE2 components identified in the gene lists. (C, b) Enrichment analysis of the hub gene network. (D, a) Hub genes of PPI network (ranking second) and MCODE2 components identified in the gene lists. (D, b) Enrichment analysis of the hub gene network. (E, a) Hub genes of PPI network (ranking third) and MCODE2 components identified in the gene lists. (E, b) Enrichment analysis of the hub gene network. (F) Volcano map of DEGs of YBX3 expression in COAD (purple: upregulation; blue: downregulation). (G) GO and KEGG pathway enrichment analyses of DEGs of YBX3 in the form of a chordal graph. (H, a) Hub genes of PPI network (ranking first) and MCODE2 components identified in the gene lists. (H, b) Enrichment analysis of the hub gene network. (I, a) Hub genes of PPI network (ranking second) and MCODE2 components identified in the gene lists. (I, b) Enrichment analysis of the hub gene network. (J, a) Hub genes of PPI network (ranking third) and MCODE2 components identified in the gene lists. (J, b) enrichment analysis of the hub gene network.

