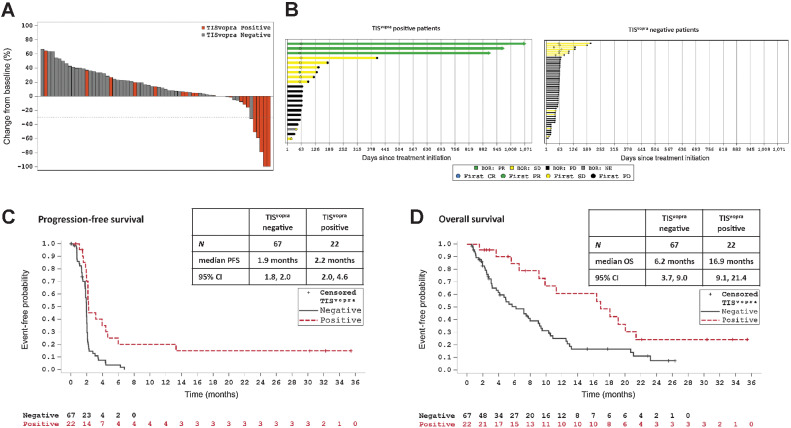
Figure 3.
TISvopra predicts tumor regression and clinical benefit. ICONIC patients treated with vopratelimab monotherapy or in combination with nivolumab who had pretreatment tumor samples that were TISvopra positive showed better outcomes to treatment than those whose tumor samples were TISvopra negative. In all panels, orange depicts TISvopra-positive patients and gray shows TISvopra-negative patients. A, Waterfall plot showing maximum reduction in the sum of diameters of target tumors compared with baseline in patients with at least one postbaseline CT scan who were assessed for TISvopra status (n = 67). B, Swimmer plots showing time on treatment for patients who were evaluated for TISvopra (n = 89). Arrows indicate patients for whom treatment is ongoing. Left, Patients who are TISvopra positive; right, patients who are TISvopra negative. BOR is evaluated using RECIST 1.1; PR is depicted in green, stable disease is depicted in yellow, PD is depicted black, NE is depicted in gray. C, PFS curves for TISvopra-positive versus TISvopra-negative patients, as evaluated by investigator review. An event is defined as PD or death (see Patients and Methods). D, OS curves for TISvopra-positive versus TISvopra-negative patients. An event is defined as death (see Patients and Methods). BOR, best overall response; CR, complete response; ICOS, inducible costimulator; PD, progressive disease; PR, partial response; RECIST, response evaluation criteria in solid tumors; SD, stable disease; TIS, tumor inflammation signature. Data cutoff for all panels is July 22, 2020.

