. 2022 Jun 28;28(17):3890–3901. doi: 10.1158/1078-0432.CCR-22-0569

Figure 4.

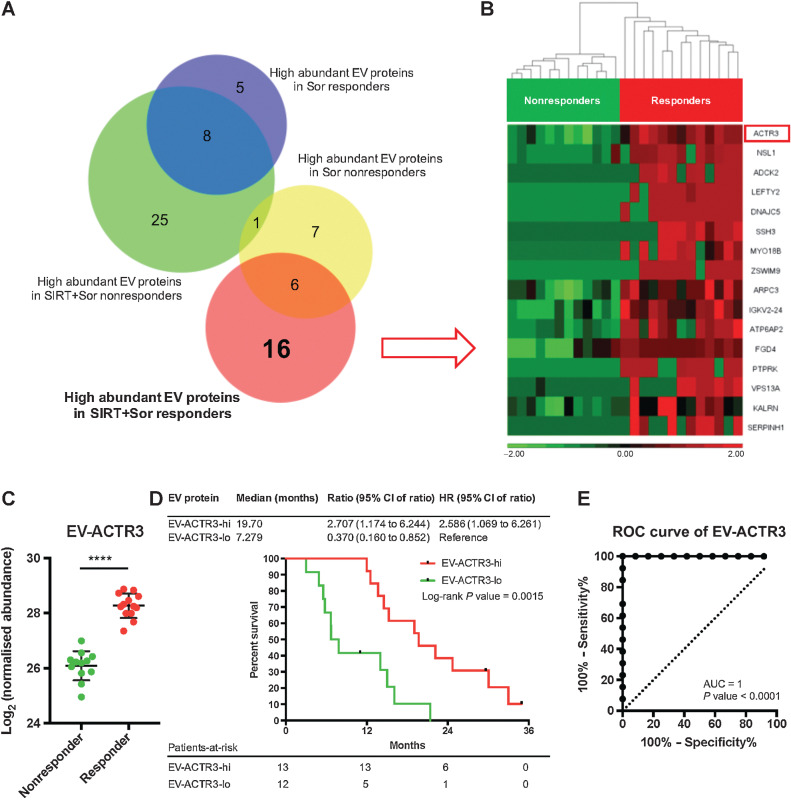
Figure 4. Identification of predictive EV proteins for SIRT+sorafenib treatment. A, Venn diagram of proteins detected from the EV samples. B, Heatmap of the differential abundance of the 16 EV proteins identified in the SIRT+sorafenib responders. Responders and nonresponders were clustered according to average linkage algorithm using Euclidean distance. Relative expression levels are represented in red and green in the heatmap. C, Abundance of EV-ACTR3 detected from responders and nonresponders from the SIRT+sorafenib group. Mann–Whitney test was used. D, Survival analysis of the patients based on the EV-ACTR3 abundance by log-rank (Mantel–Cox) test. E, ROC analysis of EV-ACTR3 for SIRT+sorafenib treatment.

Identification of predictive EV proteins for SIRT+sorafenib treatment. A, Venn diagram of proteins detected from the EV samples. B, Heatmap of the differential abundance of the 16 EV proteins identified in the SIRT+sorafenib responders. Responders and nonresponders were clustered according to average linkage algorithm using Euclidean distance. Relative expression levels are represented in red and green in the heatmap. C, Abundance of EV-ACTR3 detected from responders and nonresponders from the SIRT+sorafenib group. Mann–Whitney test was used. D, Survival analysis of the patients based on the EV-ACTR3 abundance by log-rank (Mantel–Cox) test. E, ROC analysis of EV-ACTR3 for SIRT+sorafenib treatment.