. 2022 Jun 28;28(17):3890–3901. doi: 10.1158/1078-0432.CCR-22-0569

Figure 5.

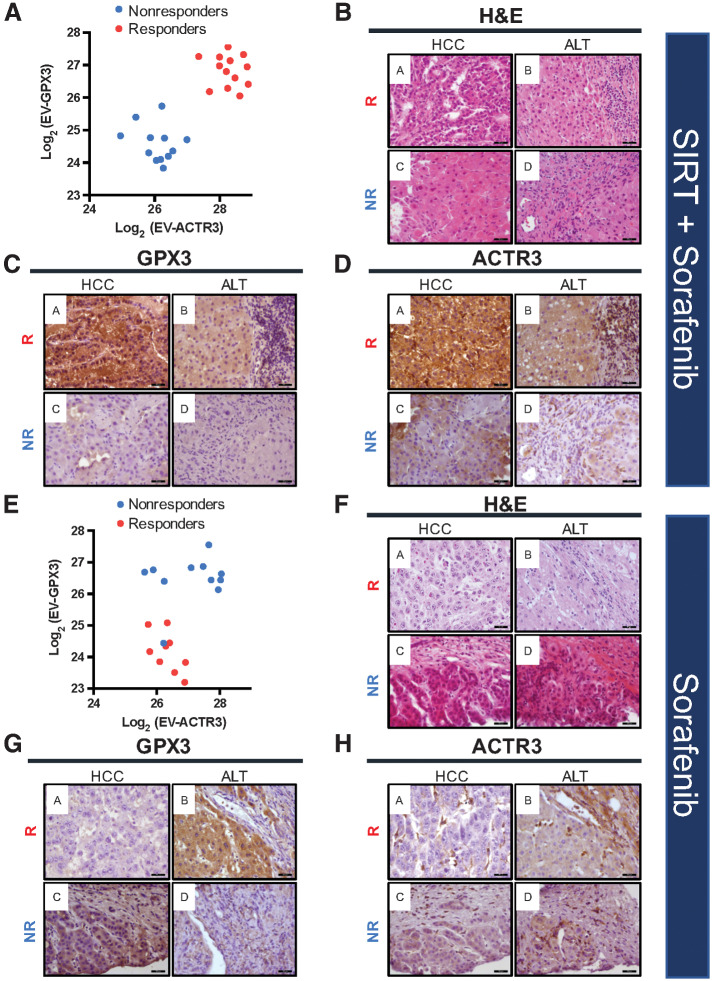
Figure 5. Levels of EV-GPX3 and EV-ACTR3 and corresponding protein expression in HCC and ALT prior to SIRT+sorafenib treatment (A–D) and sorafenib treatment (E–H) in responders (R) and nonresponders (NR). A, Correlation analysis of EV-GPX3 and EV-ACTR3 showing distinct clusters of responders and nonresponders in the SIRT+sorafenib treatment group. B, Representative images of hematoxylin and eosin (H&E) staining of HCC tissue and ALT prior to SIRT+sorafenib treatment. C, IHC staining of GPX3 in HCC tissue and ALT prior to SIRT+sorafenib treatment. D, IHC staining of ACTR3 in HCC tissue and ALT prior to SIRT+sorafenib treatment. E, Correlation analysis of EV-GPX3 and EV-ACTR3 in sorafenib treatment group. F, Representative images of H&E staining of HCC tissue and ALT prior to sorafenib treatment. G, IHC staining of GPX3 in HCC tissue and ALT prior to sorafenib treatment. H, IHC staining of ACTR3 in HCC tissue and ALT prior to sorafenib treatment. Magnification: 400×; scale bar: 50 μm.

Levels of EV-GPX3 and EV-ACTR3 and corresponding protein expression in HCC and ALT prior to SIRT+sorafenib treatment (A–D) and sorafenib treatment (E–H) in responders (R) and nonresponders (NR). A, Correlation analysis of EV-GPX3 and EV-ACTR3 showing distinct clusters of responders and nonresponders in the SIRT+sorafenib treatment group. B, Representative images of hematoxylin and eosin (H&E) staining of HCC tissue and ALT prior to SIRT+sorafenib treatment. C, IHC staining of GPX3 in HCC tissue and ALT prior to SIRT+sorafenib treatment. D, IHC staining of ACTR3 in HCC tissue and ALT prior to SIRT+sorafenib treatment. E, Correlation analysis of EV-GPX3 and EV-ACTR3 in sorafenib treatment group. F, Representative images of H&E staining of HCC tissue and ALT prior to sorafenib treatment. G, IHC staining of GPX3 in HCC tissue and ALT prior to sorafenib treatment. H, IHC staining of ACTR3 in HCC tissue and ALT prior to sorafenib treatment. Magnification: 400×; scale bar: 50 μm.