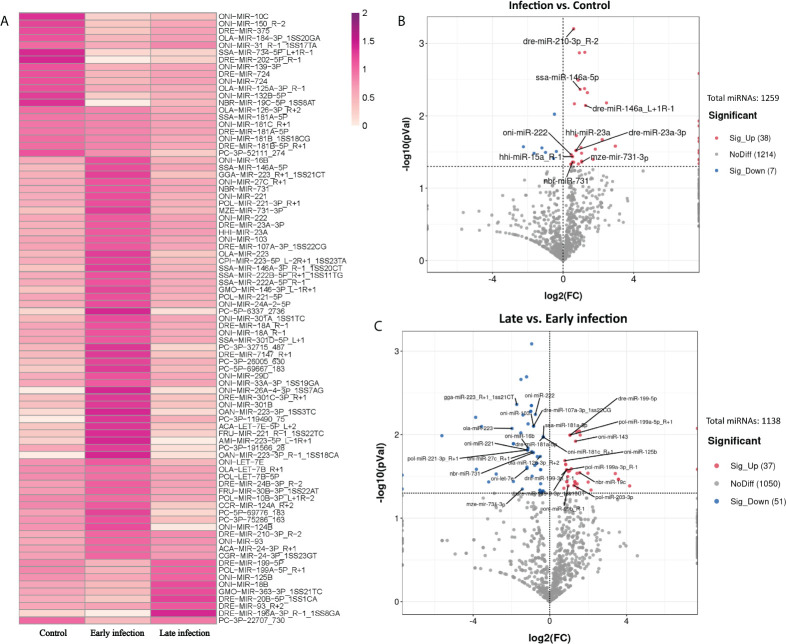
Figure 3.
Exosomal miRNAs in the plasma with distinguished levels in control, early and late infection groups. (A) Heatmap showing the levels of 85 exosomal miRNAs with significant differences in control, early and late infection groups (P < 0.05) (Dark red: higher level; Light red: lower level). (B) Volcano plot showing the levels of 45 exosomal miRNAs with significant differences between control and infection groups (P < 0.05). (Red points: higher level in infection group; Blue points: lower level in infection group; Grey points: no significant differences between control and infection groups; Points with labels: high expressed miRNAs). (C) Volcano plot showing the levels of 88 exosomal miRNAs with significant differences between early and late infection groups (P < 0.05). (Red points: higher level in late infection group; Blue points: lower level in late infection group; Grey points: no significant differences between early and late infection groups; Points with labels: high expressed miRNAs).

