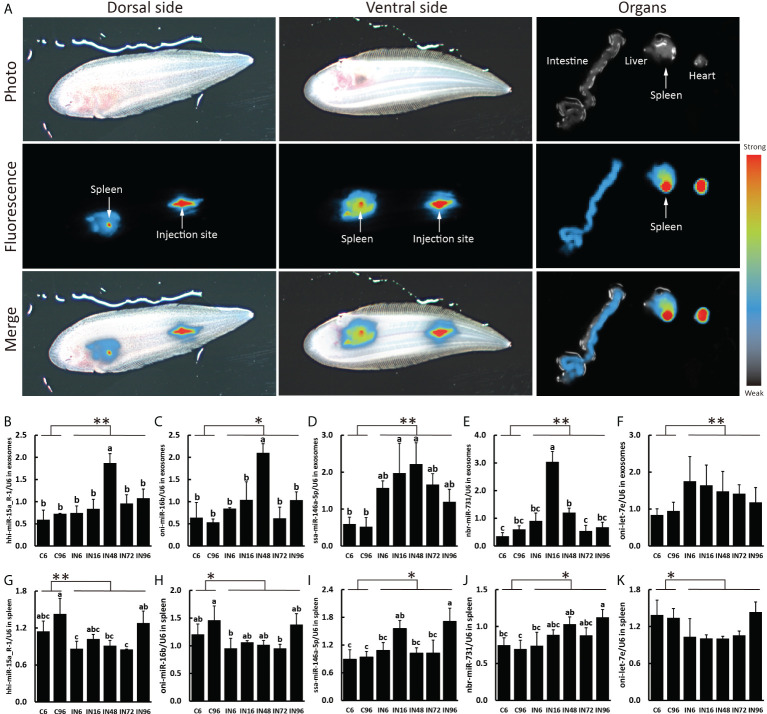
Figure 5.
Plasma exosomes biodistribution and expressions of miRNA candidates in exosomes and spleen. (A) Representative images of the plasma exosome biodistribution in live fish and their organs at 6 h after Dorsal aorta microinjection of DiR-labeled exosomes derived from plasma. Images of dorsal and ventral sides and organs were captured by IVIS. The expressions of hhi-miR-15a_R-1 (B), oni-miR-16b (C), ssa-miR-146a-5p (D), nbr-miR-731 (E), oni-let-7e (F) in exosomes and the expressions of hhi-miR-15a_R-1 (G), oni-miR-16b (H), ssa-miR-146a-5p (I), nbr-miR-731 (J), oni-let-7e (K) in spleen. Expression values were normalized by U6. Values are means (n=3) with their standard deviations represented by vertical bars. a,b,c Mean values with unlike letters were significantly different (P < 0.05, One-way analysis of variance, Tukey’s Test). **P < 0.01; *P < 0.05 versus the controls.

