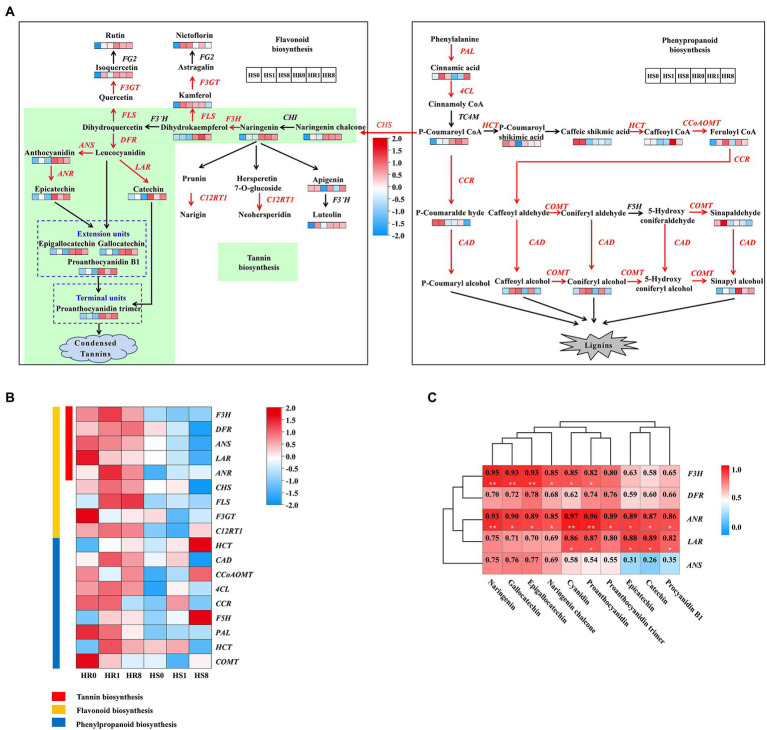
Figure 2.
Changes in expression of genes and abundances of metabolites related to flavonoid/phenylpropanoid biosynthesis during TSSM infestation on HR and HS cultivars at different infestation time points [0 d (HR0 and HS0), 1 d (HR1 and HS1), and 8 d (HR8 and HS8)]. (A) Summary of pathways of flavonoid/phenylpropanoid biosynthesis. Heatmaps are shown where the abundance of the metabolite changed significantly between the infestation times of HR and HS samples. Genes that were identified as being differentially expressed are indicated in red, definitions of the groups are presented in the black and white frames. (B) Heatmap of flavonoid/phenylpropanoid biosynthesis genes significantly affected during TSSM infestation. (C) Correlation between the DEGs and DEMs in the tannin biosynthesis pathway. Single asterisk and double asterisk indicated significant (p < 0.05) and extremely significant level (p < 0.01), respectively.

