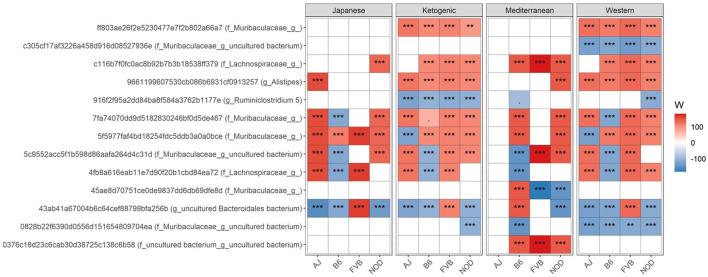
Figure 2.
Differential ASV abundance between controlled mouse diet and four popular human diet patterns. The top 20 most differentially abundant (based on cumulative ANCOM W-value) ASV were selected for the graph. On the Y-axis, maximum taxonomic information has been presented with the ASV ID. For easier presentation, ANCOM W values were converted to negative if the CLR mean abundance is lower in the popular diet patterns compared to control mouse diet. Red indicates higher ASV abundance in the popular diet pattern and blue represents higher ASV abundance in the control diet group. White represents a non-significant result obtained from ANCOM analysis. ANCOM models were FDR (BH-method) corrected and a significant sub-hypothesis test at a level of adj.P < 0.05 was counted toward W value. Models were adjusted for sex as a confounding factor and were stratified by mouse strains. “***” = ≥W0.9, “**” = ≥W0.8, and “.” = ≥W0.6. The full list of the differential ASV abundance is available in Supplementary Table 3. Corresponding differential genera abundance has been depicted in Supplementary Figure 5, and the full list is available in Supplementary Table 4.

