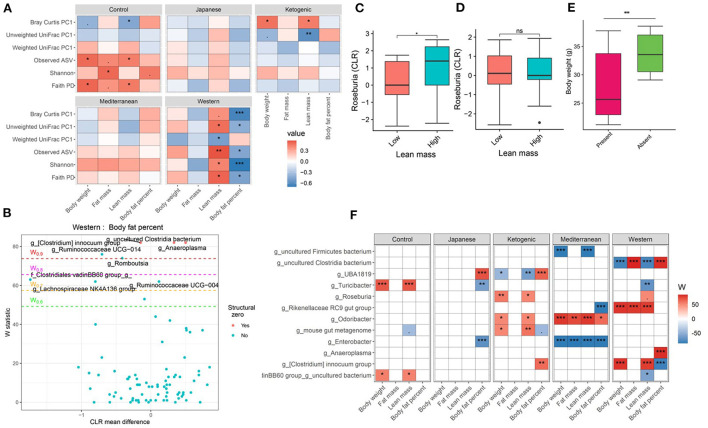
Figure 3.
Diet and gut microbiota interact to alter host body composition. (A) Association between body composition measures and α-diversity or first principal component (PC1) of β-diversity measured for each diet determined by using Spearman correlation. As indicated, red represents a positive correlation and blue represents a negative correlation. P-values were adjusted for multiple comparisons using BH method. “***” = adj.p < 0.001, “**” = adj.p < 0.01, “*” = adj.p < 0.05, and “.” = adj.p < 0.10. (B) Volcano plot of the differential genera abundance between high (above median) and low (below median) body fat percentage in mice maintained on western diet determined by ANCOM analysis. Structural zero represents the presence of the bacteria in one group and complete absence in another group. (C) Relative abundance of the Roseburia in mice having high and low lean mass maintained on the ketogenic diet. (D) Relative abundance of the Roseburia in mice with high and low lean mass maintained on the Mediterranean diet. (E) Bodyweight distribution of mice maintained on the Mediterranean diet by the presence or absence of Enterobacter in their gut microbiome. Mean abundance was compared using the Wilcoxon rank-sum test. For (C–E) “**” = P < 0.01, “*” = P < 0.05, and “ns” = not significant. (F) Differential genera abundance between high (above median) and low (below median) body composition measures determined by ANCOM analysis. 20 most differentially abundant (based on cumulative ANCOM W-value) were selected for the graph. For easier presentation, ANCOM W values were converted to negative if the CLR effect size is negative. Red indicates higher genera abundance in the above-median group and blue bacteria represents higher genera abundance in the below-median group. White represents a non-significant result obtained from ANCOM analysis. Models were adjusted for mouse strain and sex as confounding factors. The median was calculated for each diet. ANCOM models were FDR (BH-method) corrected for multiple comparisons and a significant sub-hypothesis test at a level of adj.P < 0.05 was counted toward W value. For (F), “***” = ≥W0.9, “**” = ≥W0.8, “*” = ≥W0.7, and “.” = ≥W0.6.

