
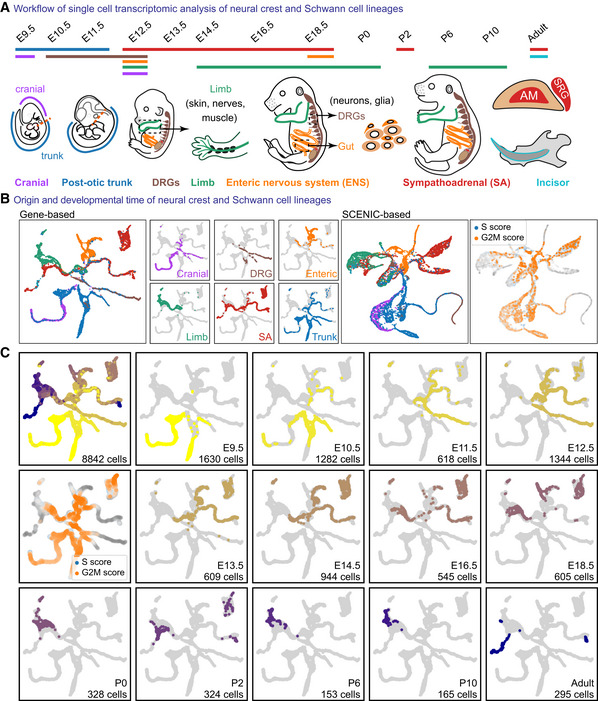
Figure EV1. Overview and composition of neural crest and Schwann cell data set.
-
AOverview of the sampled locations and time points in mice. AM, adrenal medulla; SRG, suprarenal ganglion.
-
BColour‐coded projections of the tissue of origin, including SCENIC regulon‐based UMAP embedding, with cell cycle shown (right).
-
CUMAP embeddings colour‐coded according to the developmental stage, with cell cycle shown.