
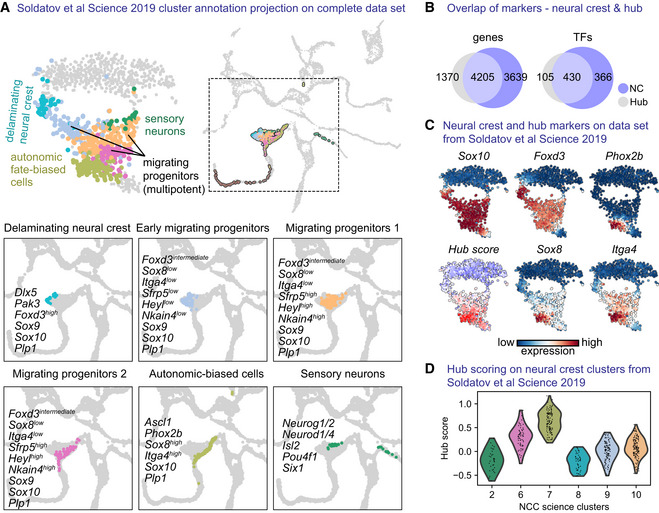
Figure EV3. Mapping and comparison of the “hub” state on previously published single‐cell data set of the neural crest.
-
AtSNE embedding and annotated clusters from Soldatov et al (2019), overlayed onto the UMAP embedding containing our own data set.
-
BVenn diagram showing genes and transcription factors (TFs) positively regulated when comparing, respectively, neural crest cells and “hub” cells to the rest of the cells of the data set (Wilcoxon rank‐sum test).
-
C“hub” scoring on previous data set using gene scoring from the top 25 differentially expressed genes specific to the “hub.”
-
DViolin plot of “hub” score over the published annotated clusters.