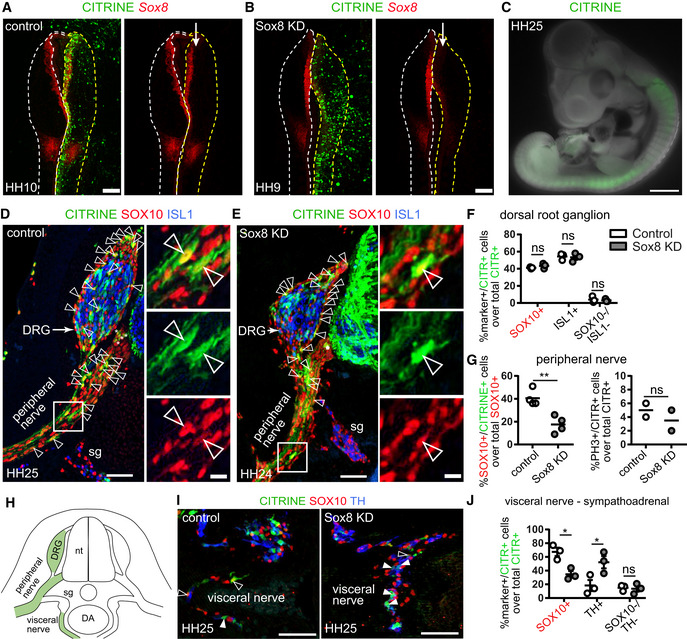
Figure 4. CRISP‐Cas9‐mediated knock down of Sox8 in developing chicken late neural crest affects migration and differentiation of “hub” cells.

-
AElectroporation of the control CRISPR‐Cas9 plasmid (CITRINE+ cells) does not affect Sox8 expression as seen by HCR against Sox8. The arrow points to the unilaterally electroporated side of the embryo. Scale bar = 200 μm.
-
BValidation of Sox8 knock down (KD) using the CRISPR‐Cas9 plasmid containing a Sox8 guide RNA by HCR. The arrow points to the unilaterally electroporated side of the embryo. Scale bar = 200 μm.
-
CCITRINE+ (electroporated) cells found migrating away from the neural tube after 3 days of culture following unilateral electroporation. Scale bar = 1 mm.
-
D, EImmunofluorescence against CITRINE (electroporated cells), SOX10 (Schwann cell precursors and Schwann cells) and ISL1 (sensory and sympathetic neurons) on embryos electroporated with either control CRISPR plasmid (D) or a CRISPR plasmid containing a guide RNA against Sox8 (E). CITRINE+ cells populate the developing dorsal root ganglia (DRG) and peripheral nerves. Examples of CITRINE+/SOX10+ cells shown by arrowheads. Asterisks show ventral boundary cap glia. Scale bar is 50 μm in overviews and 10 μm in insets.
-
FQuantification of the fate distribution of CITRINE+ cells as a % between glial (SOX10+) cells, sensory neurons (ISL1+) or neither (SOX10−/ISL1−) in the DRG of control and Sox8KD chick embryos and Sox8KD chick embryos. Biological replicates – N = 3 embryos per condition (wild‐type versus Sox8 KD). Data represented as mean ± SEM. Statistical significance determined using the Holm–Sidak method (α = 0.05; multiple t‐tests, unpaired). SOX10+ cells: P = 0.7901, ISL1+ cells: P = 0.9206, SOX10−/ISL1− cells: P = 0.9206. For statistical significance: nonsignificant P‐value ≥ 0.05.
-
GQuantification of (left) the % of SOX10+ cells in the peripheral nerves that are CITRINE+ in control and Sox8KD chick embryos and (right) the % of PH3+ CITRINE+ cells corresponding to proliferative cells. Biological replicates – N = 4 embryos per condition for SOX10+ distribution and N = 2 for PH3 quantification (wild‐type versus Sox8 KD). Data represented as mean ± SEM. Statistical significance determined unpaired t‐test with two‐tailed P‐value. SOX10+ cells: P = 0.0044, PH3+ cells: P = 0.4929. For statistical significance: nonsignificant P‐value ≥ 0.05, **P‐value < 0.01.
-
HSchematic representation of analysed anatomical locations.
-
IImmunofluorescence against CITRINE (electroporated cells), SOX10 (Schwann cell precursors and Schwann cells) and TH (sympathetic neurons and chromaffin cells) of the sympathoadrenal domain on control and Sox8KD embryos. CITRINE+/SOX10+ cells shown by empty arrowheads while CITRINE+/TH+ cells are shown by filled arrowheads. Scale bar = 50 μm.
-
JQuantification of the fate distribution of CITRINE+ cells as a % between glial (SOX10+) cells, chromaffin cells (TH+) or neither (SOX10−/TH−) in the proximity of the dorsal aorta and visceral nerve of wild‐type and Sox8 KD chick embryos. Biological replicates – N = 4 embryos per condition. Data represented as mean ± SEM. Statistical significance determined using the Holm–Sidak method (α = 0.05; multiple t‐tests, unpaired). SOX10+ cells: P = 0.0067, TH+ cells: P = 0.0067, SOX10−/TH− cells: P = 0.8819. For statistical significance: nonsignificant P‐value ≥ 0.05, *P‐value < 0.05.
Data information: In total, six embryos were analysed for the control electroporation and seven embryos were analysed for the Sox8 knock down electroporation, and data depicted in graphs correspond to mean ± SEM per embryo (corresponding to biological replicates): 3–4 electroporated embryos were analysed per condition (control and SOX8 knock down) with 4–5 sections stained and analysed per embryo per region of interest (DRG, ventral nerve, sympathoadrenal domain). The only exception is the analysis of pH3 staining where two electroporated embryos were analysed per condition with five sections stained and analysed per embryo. DA, dorsal aorta; DRG, dorsal root ganglia; nt, neural tube; sg, sympathetic ganglion.
