
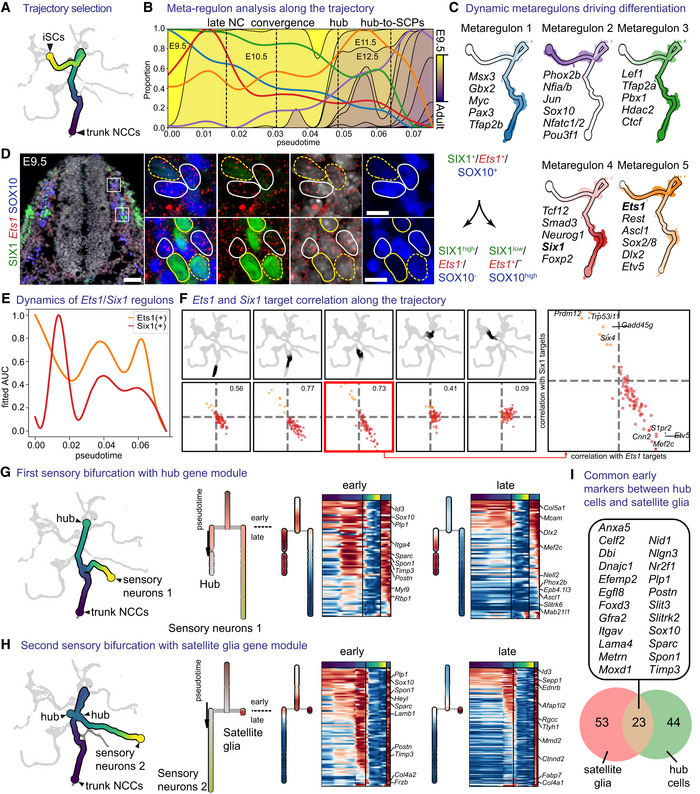
Figure 5. Dynamic changes of metaregulons shape biologically distinct stages of neural crest and Schwann cell precursor development and differentiation.
-
ASubset of the tree containing the trajectory of trunk neural crest to immature Schwann cells.
-
BProgression of the metaregulons over the trajectory selected in (A), combined with developmental time. A metaregulon is the mean expression of all regulons composing a cluster over pseudotime.
-
CTrajectory coloured by metaregulons, with a selection of regulons composing them.
-
DValidation of SIX1 and Ets1 as markers for biasing towards sensory and glia fates, respectively. Scale bar is 50 μm in the overview picture and 10 μm in the insets. Stainings were repeated on two separate occasions on two embryos from the same litter. Cells surrounded by solid white lines correspond to SIX1-/Ets1+/SOX10+ SCPs or glial fate-biased progenitors, while cells surrounded by dashed yellow lines SIX1+/Ets1- or low/SOX10- or low sensory fate-biased progenitors.
-
ENormalised regulon activity scores of Ets1 and Six1 over the trajectory.
-
FInter‐/intra‐correlation analysis of the target genes of Ets1 and Six1 regulons on nonintersecting windows of cells over the trajectory.
-
G, HBifurcation analysis over two successive sensory branches, highlighting the early and late genes biasing towards “hub” cells (G) and satellite glia (H).
-
IVenn diagram of early genes expressed in the bifurcation between “hub” and satellite glia. Gene list shows the common genes between the two.
Data information: iSCs, immature Schwann cells; NCCs, neural crest cells.