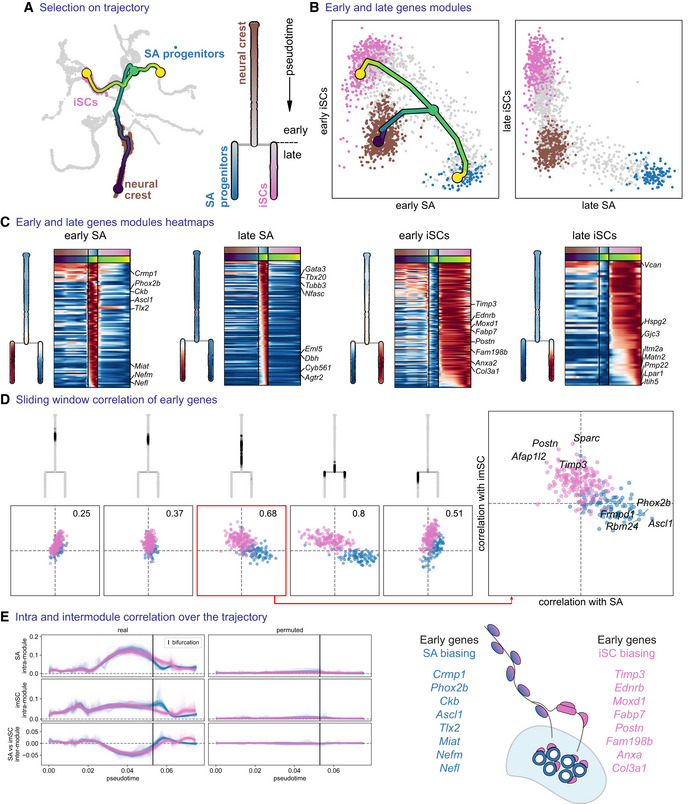
Figure 6. Biasing of bipotent progenitors through the “hub” state towards sympathoadrenal progenitors and immature Schwann cells.

-
ASubset tree selection of the trajectory from trunk NCCs to immature Schwann cells versus sympathoadrenal progenitors. An abstract dendrogram is displayed on the right.
-
BMean expression of early and late gene modules for each branch and overlayed tree on the early gene modules.
-
CHeatmap of early and late genes for each branch, with mean expression shown on the dendrogram representations.
-
DInter‐/intra‐correlation analysis of early gene modules of both branches, on nonintersecting windows of cells over the trajectory.
-
EInter‐ and intra‐module correlation performed on a sliding window of cells (over 100 probabilistic mappings of the trajectory) along the pseudotime axis. iSCs, immature Schwann cells; SA progenitors, sympathoadrenal progenitors.
