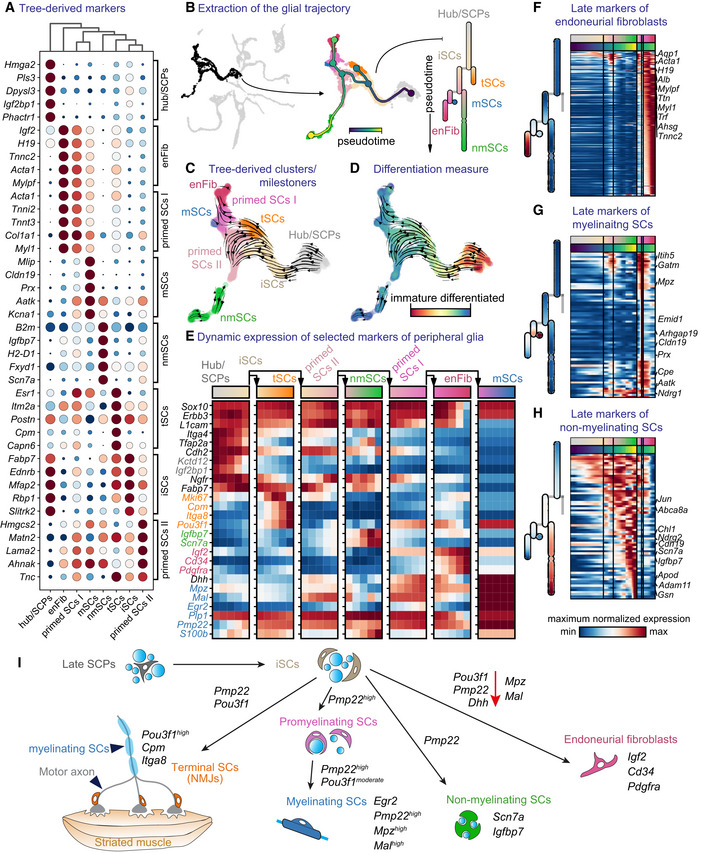
Figure 7. Heterogeneity of Schwann cells and fate biasing in maturing peripheral nerves.

-
ADot plot of the top five differentially expressed genes from the milestones of the glial trajectory.
-
BLeft: selected cells (Foster et al, 2020) of the glial trajectory, middle: constructed tree overlayed on the UMAP, right: abstract dendrogram.
-
CRNA velocity on tree‐derived clusters (milestones).
-
DRNA velocity with CytoTRACE overlayed on the UMAP.
-
EDynamics of expression of known markers over the trajectory summarised over five bins per segment of the tree.
-
F–HHeatmap of late markers of the three endpoints of differentiation from immature Schwann cells: endoneurial fibroblasts (F) and myelinating (G) or nonmyelinating Schwann cells (H).
-
ISchematic representation of transitions from late “hub” cells biased to immature Schwann cells to all end fates along with mixed motor and sensory nerves.
Data information: enFibr, endoneurial fibroblasts; iSCs, immature Schwann cells; mSCs, myelinating Schwann cells; NMJs, neuromuscular junctions; nmSCs, non‐myelinating Schwann cells; SCPs, Schwann cell precursors; tSCs, terminal Schwann cells.
