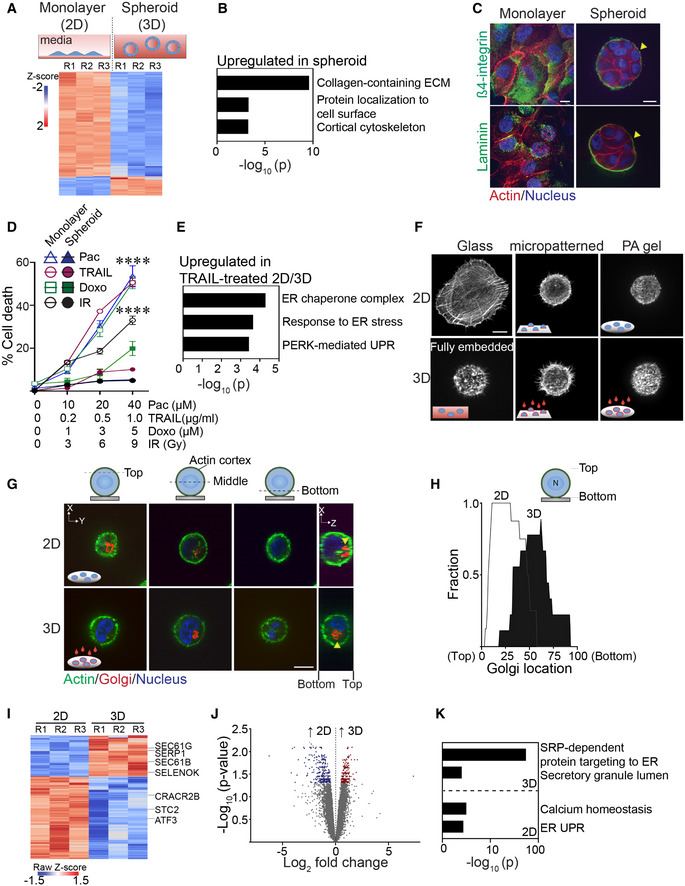
Figure 1. Ligation of rBM in 2D versus 3D regulates expression of molecules implicated in ER function.

-
ASchematic of experimental setup depicting MECs grown as monolayers on a rigid rBM (two‐dimensional culture model, 2D; top left) or within a compliant rBM to generate multicellular spheroid structures with apical‐basal polarity (three‐dimensional culture model, 3D) top right). Heatmap of microarray analysis of gene expression in HMT‐3522 S‐1 MECs cultured either as a 2D monolayer or as spheroids (Bottom). Expression of the top 200 differentially expressed genes between the two experimental conditions (n = 3 independent biological replicates; R = replicate).
-
BGene Ontology (GO) analysis of genes upregulated in HMT‐3522 S‐1 spheroids.
-
CSamples were stained with antibodies for β4‐integrin or laminin (green; yellow arrows). The actin and nucleus were counterstained with phalloidin (red) and DAPI (blue), respectively. Scale bar, 10 μm.
-
DHMT‐3522 S‐1 MECs plated as monolayers on a rigid rBM (2D) or as spheroids within rBM (3D) were treated with increasing doses of Paclitaxel (Pac), TRAIL, Doxorubicin (Doxo) and irradiation (IR). Percent cell death was quantified by immunofluorescence as percentage of cells stained positive for cleaved caspase‐3 at 48 h posttreatment (mean ± SEM; n = 3 independent biological replicates). ****P < 0.0001 (Student's t‐test).
-
EGene ontology (GO) analysis of genes significantly upregulated in TRAIL‐treated HMT‐3522 S‐1 MEC monolayers (2D) relative to TRAIL‐treated spheroid cultures (3D).
-
FRepresentative immunofluorescence microscopy images of MCF10A MECs plated in the indicated conditions for 18 h and stained with phalloidin to reveal F‐actin organization. Cells were plated as single cells on rigid glass coverslips (2D glass; top left) or fully embedded within rBM (3D fully embedded; bottom left). Cell spreading was inhibited by plating cells on either laminin‐111 conjugated, 10‐μm micropatterned glass (2D/micropatterned, rigid substrate; top middle) or on compliant 75 Pa rBM‐laminated polyacrylamide (PA) gels (2D/PA, soft substrate; top right). The single 2D cells were overlaid with either purified laminin‐111 (bottom middle) or rBM (bottom right) to create a 3D ECM microenvironment. Images show maximum intensity z‐projections of confocal stacks for F‐actin phalloidin staining. Scale bar, 10 μm.
-
GRepresentative immunofluorescence microscopy images of MCF10A MECs stably expressing recombinant mCherry‐tagged golgi marker (mCherry‐GalT; red; yellow arrows) ligated with rBM in either 2D or 3D for 18 h. The actin cortex and nucleus were counterstained with phalloidin (green) and DAPI (blue), respectively. Images show the cross‐sectional view of each cell compartment (dashed lines; xy plane) and side view of confocal stacks (xz plane) in individual MCF10A MECs. Scale bar, 10 μm.
-
HGolgi staining was assessed within non‐spread MCF10A MECs ligated with rBM in 2D and 3D for 18 h and values were plotted as a function of subcellular localization (2D, n = 8; 3D, n = 9 cells from two independent experiments).
-
IHeatmap of RNA‐seq experiment from MCF10A MECs ligated with rBM in 2D and 3D 12 h post‐plating. Data show the expression of the top 200 genes that are differentially expressed between the 2D and 3D rBM conditions. (n = 3 independent biological replicates).
-
JVolcano plot of differentially expressed genes from RNA‐seq of MCF10A MECs ligated to rBM in 2D and 3D harvested 12 h post‐plating. Significantly downregulated genes (blue; log 2 > 0.5) and upregulated genes (red; log 2 > 0.5) are highlighted (n = 3 independent biological replicates).
-
KGO analysis of genes significantly upregulated in non‐spread MCF10A MECs ligated to rBM in 3D relative to those interacting with a rBM in 2D.
Source data are available online for this figure.
