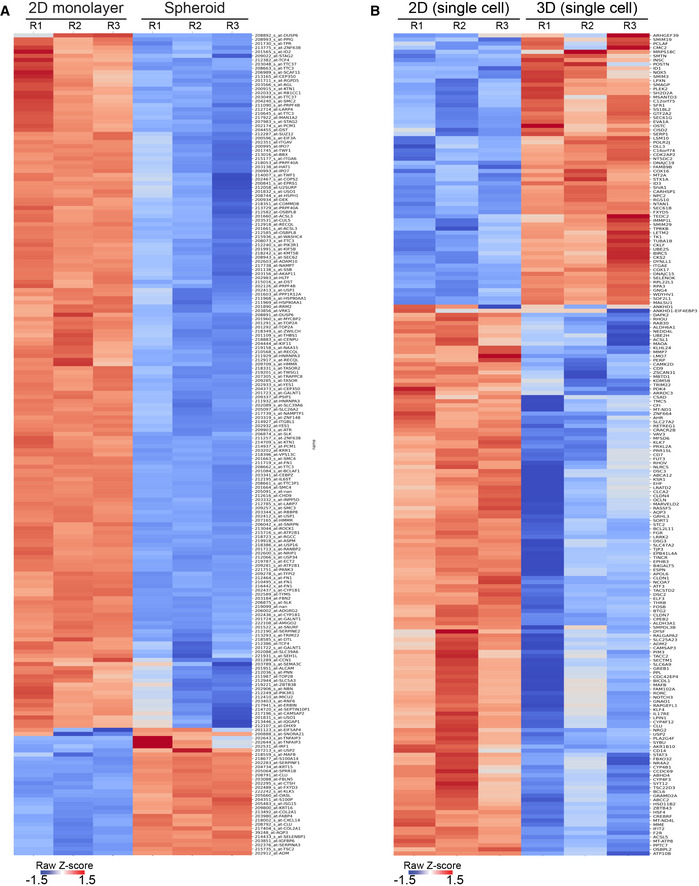
Figure EV1. Ligation of rBM in 2D versus 3D alters cellular gene expression profiles.

-
AHeatmap of microarray analysis of gene expression in HMT‐3522 S‐1 MECs cultured either as a 2D monolayer or as spheroids. The top 200 differentially expressed genes are shown (n = 3 independent biological replicates).
-
BHeatmap of RNA‐seq experiment from MCF10A MECs ligated with rBM in 2D and 3D at 12 h post‐plating. The top 200 genes differentially expressed between the 2D and 3D rBM conditions are shown (n = 3 independent biological replicates).
