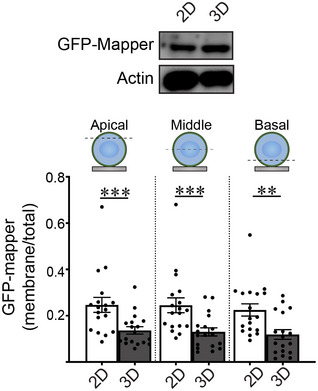
Figure EV2. rBM ligation in 3D decreases ER‐PM contact site formation.

(Top) Expression levels of GFP‐MAPPER in MCF10A MECs ligated with rBM in 2D or 3D was assessed by immunoblotting. Actin was used as the loading control. (Bottom) Quantification of levels of plasma membrane‐proximal GFP‐MAPPER in different focal planes (apical, middle, and basal) in MCF10A MECs ligated with rBM in 2D or 3D. The abundance of ER‐PM contact sites in MECs was quantified as plasma membrane fluorescence relative to total fluorescence (mean ± SEM; 2D, n = 18; 3D, n = 18 cells from two independent experiments). Statistical analysis by one‐way ANOVA followed by Uncorrected Fisher's LSD. Apical 2D versus 3D, ***P = 0.0007; middle 2D versus 3D, ***P = 0.0004; basal 2D versus 3D, **P = 0.0011.
