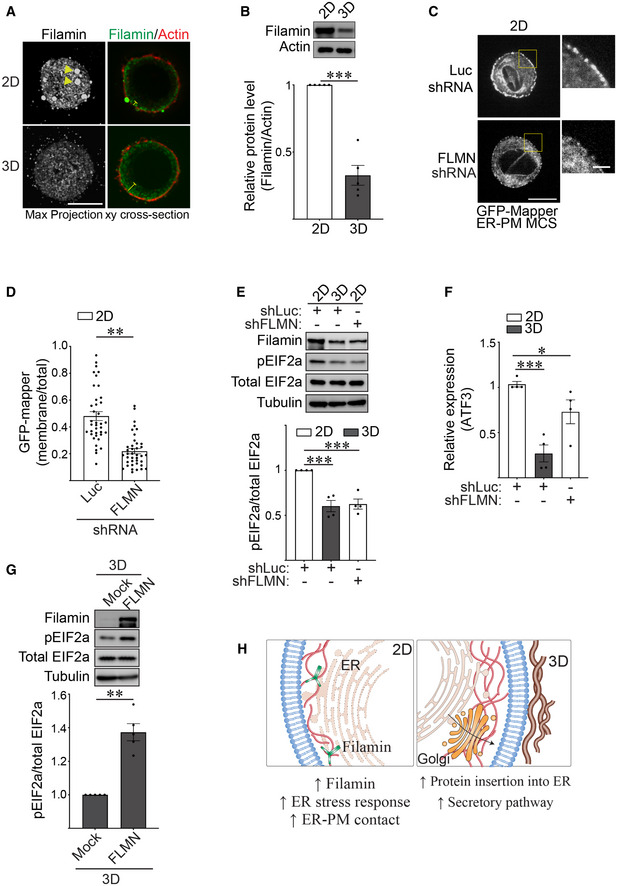
Figure 3. Ligation of rBM in 3D modulates filamin to alter ER function.

-
ARepresentative immunofluorescence microscopy images of MCF10A MECs ligated with either a rBM in 2D or 3D for 18 h and stained with antibody targeting filamin (green). F‐actin was counterstained with phalloidin (red). Images show maximum intensity z‐projections of xy confocal stacks (left) and middle focal plane of confocal stacks from MECs (right). Yellow arrows indicate filamin aggregates in individual MECs ligated to rBM in 2D. Yellow blunt‐end lines highlight the extent of filamin distribution away from the cell edge. Scale bar, 10 μm.
-
BThe expression level of filamin in MCF10A MECs ligated to rBM in 2D and 3D for 18 h was assessed via immunoblot and quantified relative to actin loading control (mean ± SEM; n = 5 independent biological replicates). ***P = 0.0008 (Student's t‐test).
-
CRepresentative fluorescence microscopy images of MCF10A MECs co‐expressing the ER‐plasma membrane contact site reporter GFP‐MAPPER and shRNA targeting filamin (FLMN) or luciferase (Luc) ligated to rBM in 2D for 18 h. Scale bar (whole cell), 10 μm; Scale bar (magnified), 2 μm.
-
DQuantification of the levels of GFP‐MAPPER at the plasma membrane versus total cellular fluorescence in MCF10A MECs stably expressing an shRNA targeting filamin (FLMN) or luciferase (Luc) ligated to rBM in 2D (mean ± SEM; 2D + shLuc, n = 38; 2D + shFLMN, n = 39 cells from three independent experiments). **P < 0.0021 (Student's t‐test).
-
ERepresentative immunoblots of filamin, phosphorylated EIF2a (pEIF2a), total EIF2a and alpha‐tubulin in cell lysate from MCF10A MECs that express shRNA targeting filamin (shFLMN) or luciferase (shLuc) and ligated to a rBM in 2D or 3D for 18 h and corresponding quantification data (mean ± SEM; n = 4 independent biological replicates). Statistical analysis by one‐way ANOVA followed by Uncorrected Fisher's LSD. 2D‐shLuc versus 3D‐shLuc, ***P = 0.0003. 2D‐shLuc versus 2D‐shFLMN, ***P = 0.0004.
-
FBar graph of the relative levels of ATF3 mRNA as measured by qPCR in MCF10A MECs expressing shRNA targeting filamin (shFLMN) or luciferase (shLuc) and ligated with rBM in 2D or 3D for 18 h (mean ± SEM; n = 4 independent biological replicates). Statistical analysis by one‐way ANOVA followed by Uncorrected Fisher's LSD. 2D‐shLuc versus 3D‐shLuc, ***P = 0.0005. 2D‐shLuc versus 2D‐shFLMN, *P = 0.0359.
-
GRepresentative immunoblots of filamin, phosphorylated EIF2a (pEIF2a), total EIF2a and alpha‐tubulin in cell lysate from MCF10A MECs ligated to rBM in 3D and treated with ethanol (mock) or doxycycline (FLMN) for 18 h to induce filamin expression and corresponding quantification data (mean ± SEM; n = 5 independent biological replicates). **P = 0.0018 (Student's t‐test).
-
HModel of how ECM dimensionality affects ER function via filamin.
Source data are available online for this figure.
