
Figure EV3. Representative AFM force curve and TFM force map.
-
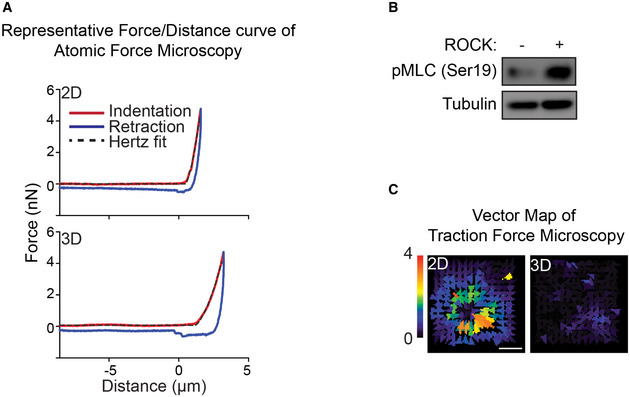
ARepresentative AFM force‐distance curve of MECs interacting with either laminin‐111 in 2D or 3D. The indentation curve (red), retraction curve (blue), and Hertz model fit of the indentation curve (black dash line) are shown. The indentation curve of MECs ligated to rBM in 3D exhibits a similar pattern of classical AFM indentation curve.
-
BROCK activity in MCF10A MECs ligated to rBM in 3D for 18 h was assessed via immunoblot for Ser19 phosphorylated myosin light chain (pMLC) relative to alpha‐tubulin loading control.
-
CBead displacement field of MECs ligated to a rBM in 2D or 3D is displayed as a color‐coded vector map. Scale bar, 10 μm.