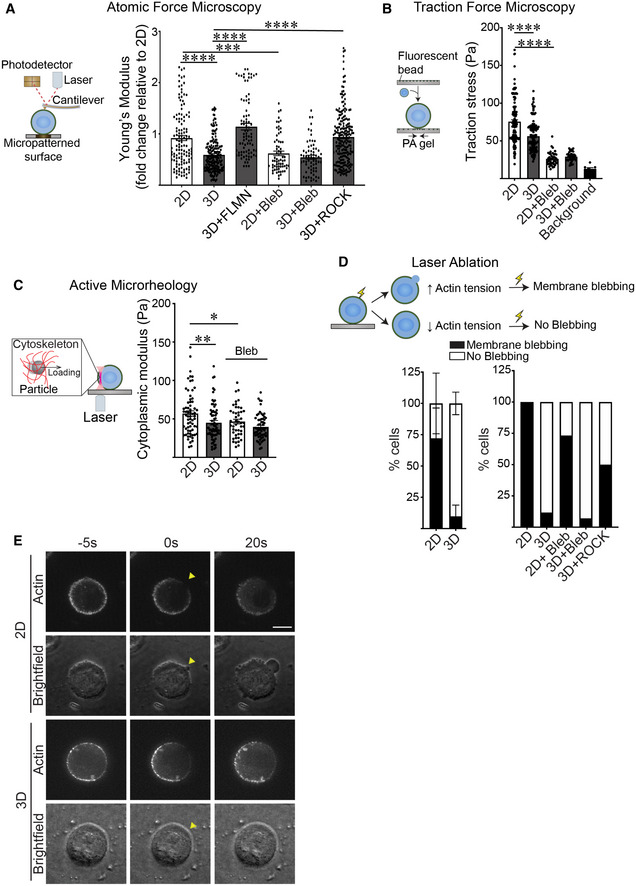
Figure 4. Ligation of rBM in 3D reduces actin tension.

-
ASchematic showing the principles behind Atomic Force Microscopy (AFM) (left). A cantilever at the end of the microscope probe is deflected when it is in contact with the cell surface. Cell cortex‐mediated resistance to indentation alters the path of the laser beam focused on the cantilever that is then reflected onto a photodetector to enable measurement of cellular cortical actin tension. AFM was used to measure the cortical actin tension in MCF10A MECs ligated to a laminin‐111 substrate in 2D or 3D (right) and treated with blebbistatin (Bleb) to reduce cortical actin tension, induced to overexpress filamin expression (FLMN), or activated ROCK (ROCK) to increase cortical actin tension. MECs were indented using a 2‐μm beaded tip on the AFM cantilever and the Hertz model was used to fit each indentation curve to extract the Young's modulus of the cell cortex (mean ± SEM; 2D, n = 123; 3D, n = 184; 3D + FLMN, n = 83; 2D + Bleb, n = 66; 3D + Bleb, n = 65; 3D + ROCK, n = 212; n = AFM indentation from >30 cells from three independent experiments). Statistical analysis by one‐way ANOVA followed by Tukey's multiple comparisons test. 2D versus 3D, ****P < 0.0001; 3D versus 3D + FLMN, ****P < 0.0001; 3D versus 3D + ROCK, ****P < 0.0001; 2D versus 2D + Bleb, ***P = 0.0004.
-
BSchematic of the principles behind traction force microscopy (left). MECs are plated on compliant polyacrylamide gels containing 100 nm fluorescent beads (close to the cell‐polyacrylamide gel interface). Traction stresses are calculated based on the bead displacement induced by substrate deformation and relaxation. Quantification of the traction stresses in individual MCF10A MECs ligated with rBM in 2D and 3D and treated in the absence and presence of blebbistatin (Bleb) for 18 h (right; mean ± SEM; 2D, n = 139; 3D, n = 124; 2D + Bleb, n = 42; 3D + Bleb, n = 43 cells from three independent experiments). The background bead displacement was measured from gel areas that lacked ligated cells (n = 8 fields from one experiment). Statistical analysis by one‐way ANOVA followed by Tukey's multiple comparisons test. ****P < 0.0001.
-
CSchematic of the principle of active microrheology (left). MCF10A MECs endocytosed 0.5 μm polystyrene particles, which were trapped and oscillated using laser optical tweezers to measure the cytoplasmic modulus. The cytoplasmic modulus was measured for MECs ligated to a rBM in 2D or 3D and treated in the absence or presence of blebbistatin (Bleb) to reduce cortical actin tension (right); individual modulus values were calculated based on the slope in the linear range of the normalized force‐displacement curve (mean ± SEM; 2D, n = 66; 3D, n = 69; 2D + Bleb, n = 46; 3D + Bleb, n = 60 cells from three independent experiments). Statistical analysis by one‐way ANOVA followed by Uncorrected Fisher's LSD. 2D versus 3D, **P = 0.0028. 2D versus 2D + Bleb, *P = 0.0182.
-
DSchematic depicting strategy used to measure cortical tension using laser ablation. (Top) Cells with high cortical tension exhibit plasma membrane blebbing when cortical actin is severed by a pulsed laser, whereas cells with lower cortical tension do not. (Bottom left) Bar graph of the laser ablation response of MCF10A MECs ligated to a rBM in 2D or 3D (mean ± SD; 2D, n = 35; 3D, n = 40 cells from three independent experiments). (Bottom right) Bar graph showing the laser ablation response of MCF10A MECs ligated to a rBM in 2D or 3D and treated in the absence or presence of blebbistatin (2D + Bleb and 3D + Bleb) or expressing constitutively active ROCK (3D + ROCK) (mean; 2D, n = 14; 3D, n = 15; 2D + Bleb, n = 17; 3D + Bleb, n = 14; 3D+ ROCK, n = 10 cells from one experiment).
-
ERepresentative fluorescence and brightfield images of bleb formation induced by laser ablation in MECs stably expressing LifeAct‐RFP. Arrowhead: the site of laser ablation. Scale bar, 10 μm.
Source data are available online for this figure.
