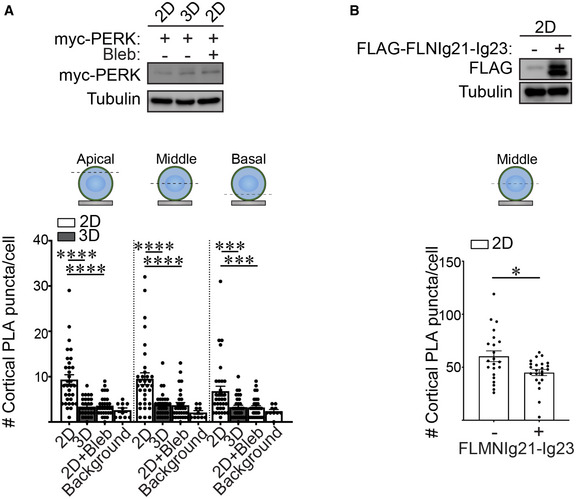
A(Top) Immunoblots of myc‐PERK and alpha‐tubulin (control) in lysate from MCF10A MECs harboring doxycycline‐inducible myc‐PERK. MCF10A MECs were ligated with rBM in 2D or 3D for 18 h and treated with doxycycline for 7 h. (Bottom) Quantification of PLA signals within the actin cortex (cortical PLA puncta) at different focal planes (apical, middle, and basal) in MCF10A MECs expressing doxycycline‐inducible myc‐PERK. MECs were ligated with rBM in 2D or 3D in the absence or presence of blebbistatin (2D + Bleb) for 18 h and myc‐PERK was induced for 7 h prior to PLA. The number of PLA puncta per cell were quantified to measure of the levels of interaction between filamin and PERK. Background PLA signal was measured from cells that were stained in the absence of primary antibodies (mean ± SEM; 2D, n = 33; 3D, n = 30 cells; 2D + Bleb, n = 30; background, n = 10 cells from three independent experiments). Statistical analysis by one‐way ANOVA followed by Uncorrected Fisher's LSD. ****P < 0.0001; basal 2D versus 3D, ***P = 0.0010; basal 2D versus 2D + Bleb, ***P = 0.0008.

