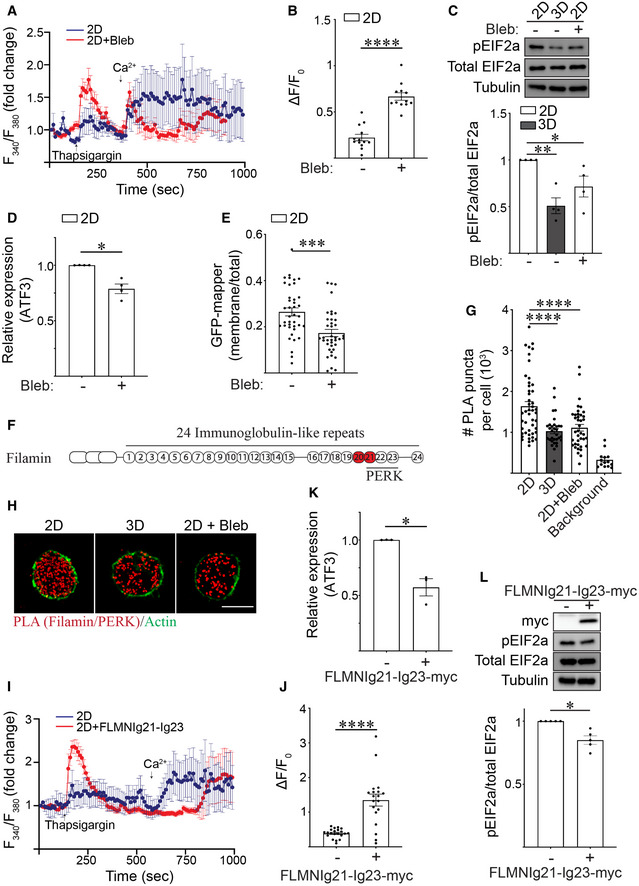
Figure 5. Ligation of rBM in 3D reduces actin tension‐dependent filamin‐ER binding to regulate ER function.

-
ARepresentative line graph showing the changes in cytosolic [Ca2+] levels of MCF10A MECs in response to treatment. Fura‐2‐loaded MECs ligated with rBM in 2D were treated with DMSO (2D; blue) or with blebbistatin (2D + Bleb; red) and preincubated with EGTA to chelate extracellular Ca2+ in the bath solution, challenged with 2 μM thapsigargin to induce ER Ca2+ release, and replenished with 4 mM Ca2+ in bath solution at the indicated times. F340/F380 values for each cell were quantified over the course of imaging and plotted (mean ± SD; 2D, n = 7; 2D + Bleb, n = 7 cells from one experiment).
-
BQuantification of the amplitude of the Ca2+ response (ΔF=F‐F0) induced by thapsigargin, where F0 is the basal fluorescence before thapsigargin treatment. The data shown indicated mean ± SEM (2D, n = 13; 2D + Bleb, n = 12 cells from two independent experiments). ****P < 0.0001 (Student's t‐test).
-
CRepresentative immunoblots of phosphorylated EIF2a (pEIF2a), total EIF2a and alpha‐tubulin in cell lysate from MCF10A MECs ligated to a rBM in 2D or 3D and treated in the absence or presence of blebbistatin (Bleb). Corresponding quantification data are shown at bottom (mean ± SEM; n = 4 independent biological replicates). Statistical analysis by one‐way ANOVA followed by Uncorrected Fisher's LSD. 2D versus 3D, **P = 0.0022. 2D versus 2D + Bleb, *P = 0.0248.
-
DBar graph of qPCR data measuring the relative levels of ATF3 mRNA in MECs ligated with rBM in 2D and treated in the absence or presence of blebbistatin (Bleb) (mean ± SEM; n = 4 independent biological replicates). *P = 0.0158 (Student's t‐test).
-
EGraph of the levels of GFP‐MAPPER at the plasma membrane relative total cellular GFP‐MAPPER fluorescence in MCF10A MECs ligated with rBM in 2D and treated in the absence or presence of blebbistatin (Bleb) (mean ± SEM; 2D, n = 39; 2D + Bleb, n = 39 cells from three independent experiments). ***P = 0.0002 (Student's t‐test).
-
FSchematic showing the immunoglobulin(Ig)‐like repeats within filamin and the PERK‐interacting domains identified within this repeat region (Ig21‐23). The mechanosensitive domains Ig20‐21 is highlighted in red.
-
GScatter plot of the number of proximity ligation assay (PLA) puncta within individual cells expressing myc‐PERK that were ligated to rBM in 2D or 3D, treated in the absence or presence of blebbistatin (Bleb) for 25 h and stained with PLA antibody probes specific for endogenous filamin and myc‐PERK. Representative images of PLA staining from these experiments can be found in Panel H. Background PLA signal was measured from cells stained in the absence of primary antibodies (mean ± SEM; 2D, n = 47; 3D, n = 32 cells; 2D + Bleb, n = 39; background, n = 14 cells from three independent experiments). Statistical analysis by one‐way ANOVA followed by Uncorrected Fisher's LSD. ****P < 0.0001.
-
HRepresentative fluorescence microscopy images of cells expressing myc‐PERK that were ligated to rBM in 2D or 3D, treated in the absence or presence of blebbistatin (Bleb) for 25 h and stained with PLA antibody probes specific for endogenous filamin and myc‐PERK (red puncta). F‐actin was stained with phalloidin to outline the cell (green). Scale bar, 10 μm. Puncta quantification data for this experiment is plotted in Panel G.
-
IRepresentative line graph showing the changes in cytosolic [Ca2+] levels of MCF10A MECs in response to treatment. Fura‐2‐loaded MCF10A MECs ligated with rBM in 2D and expressing filamin repeats 21–23 (2D + FLMNIg21‐Ig23) or vector control (2D) were pre‐incubated with EGTA to chelate extracellular Ca2+ in the bath solution, challenged with 2 μM thapsigargin to induce ER Ca2+ release, and replenished with 4 mM Ca2+ in bath solution at the indicated time. F340/F380 values of individual cells were quantified over the course of imaging (mean ± SD (2D, n = 8; 2D + FLMNIg21‐Ig23, n = 7 cells from one experiment).
-
JQuantification of the amplitude of the Ca2+ response (ΔF=F‐F0) induced by thapsigargin, where F0 is the basal fluorescence before thapsigargin treatment. The data shown indicated mean ± SEM (2D, n = 21; 2D + FLMNIg21‐Ig23, n = 19 cells from three independent experiments). ****P < 0.0001 (Student's t‐test).
-
KBar graph of qPCR data measuring the relative levels of ATF3 mRNA in MCF10A MECs expressing luciferase control or filamin repeats 21–23 (FLMNIg21‐Ig23) ligated with rBM in 2D for 18 h (mean ± SEM; n = 3 independent biological replicates). *P = 0.032 (Student's t‐test).
-
LRepresentative immunoblots of phosphorylated EIF2a (pEIF2a), total EIF2a and alpha‐tubulin in cell lysate from MCF10A MECs expressing luciferase (control) or filamin repeats 21–23 (FLMNIg21‐Ig23‐myc) that were ligated with rBM in 2D. Corresponding quantification data are shown at bottom (mean ± SEM; n = 5 independent biological replicates). *P = 0.0112 (Student's t‐test).
Source data are available online for this figure.
