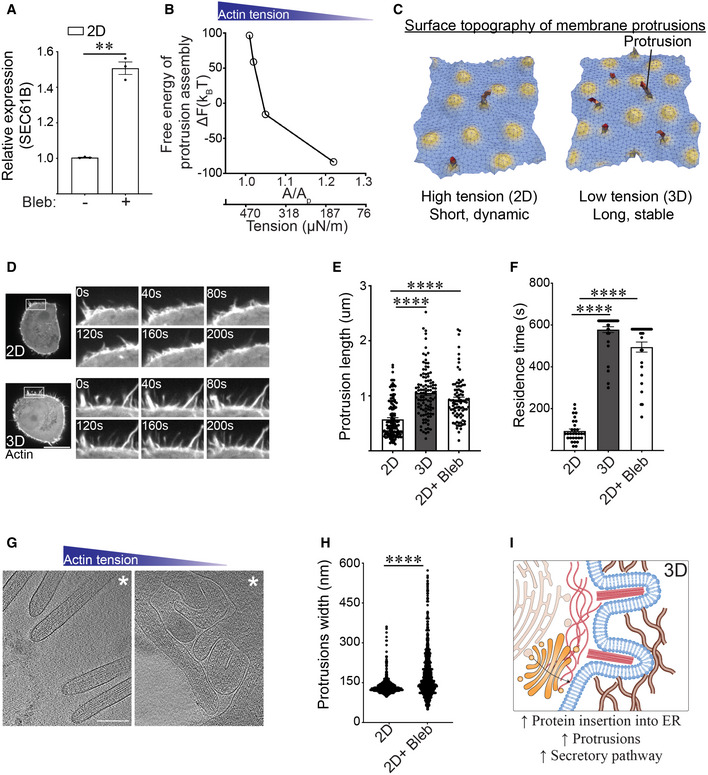
Figure 6. Cortical actin tension modulates plasma membrane topology.

-
ABar graph of qPCR data measuring the levels of SEC61B mRNA in MECs ligated with rBM in 2D and treated in the absence and presence of blebbistatin (Bleb) (mean ± SEM; n = 3 independent biological replicates). **P = 0.0046 (Student's t‐test).
-
BChange in the Helmholtz free energy of membrane protrusion assembly (ΔF) as a function of cell membrane excess area (A/Ap), which is the variable conjugate to the cortical actin tension.
-
CRepresentative snapshots from a typical membrane patch with properties of the plasma membrane showing that protrusion length is higher in low‐tension (3D) conditions compared to high‐tension (2D) conditions. The model predicts that cells interacting with a rBM in 2D that experience high actin tension will form shorter and/or more dynamic membrane protrusions. In contrast, cells that experience low actin tension, as is the case for MECs interacting with a rBM in 3D (3D), are predicted to form longer and more stable membrane protrusions.
-
DRepresentative time‐lapse confocal microscopy images of MECs stably expressing LifeAct‐RFP that were ligated to a rBM in 2D (2D) or 3D (3D). Time in seconds (s) is indicated in each inset; scale bar, 10 μm.
-
EBar graph of protrusion length measurements in MECs ligated to rBM in 2D, 3D, or in 2D treated with blebbistatin (2D + Bleb) (mean ± SEM; 2D, n = 139; 3D, n = 106; 2D + Bleb, n = 88 protrusions from three independent experiments). Statistical analysis by one‐way ANOVA followed by Uncorrected Fisher's LSD. ****P < 0.0001.
-
FBar graph of protrusion residence time measurements in MECs ligated to rBM in 2D (2D), 3D (3D), or in 2D treated with blebbistatin (2D+ Bleb) (mean ± SEM; 2D, n = 30; 3D, n = 30; 2D + Bleb, n = 38 protrusions from three independent experiments). Statistical analysis by one‐way ANOVA followed by Uncorrected Fisher's LSD. ****P < 0.0001.
-
G30‐nm thick slice through a cellular tomogram focusing on protrusions emanating from a vitrified no‐spread MECs cultured on a rBM in the absence (left, 2D) or in the presence of blebbistatin (right, 2D+ Bleb). The position of the cell body is toward the upper right‐hand corner (marked with white asterisk). Scale bars, 200 nm. Note: under conditions of low cortical actin tension (blebbistatin treatment) the protrusions visualized in these MECs appeared to be highly interdigitated with sharp kinks, consistent with a compliant phenotype. By contrast, the protrusions observed in the 2D samples (higher cortical actin tension) were predominantly straight and outwardly projected, suggesting they were stiffer than the protrusions formed in the MECs with lower cortical actin tension (e.g., blebbistatin treated).
-
HQuantification of membrane protrusion width in tomograms from non‐spread MECs interacting with rBM treated with (2D + Bleb) and without blebbistatin (2D). n > 2,000 protrusions. Statistical significance of differences between the distributions was assessed using Mann–Whitney rank tests. ****P < 0.0001.
-
IModel of how reduced cortical tension influences membrane protrusion phenotype.
Source data are available online for this figure.
