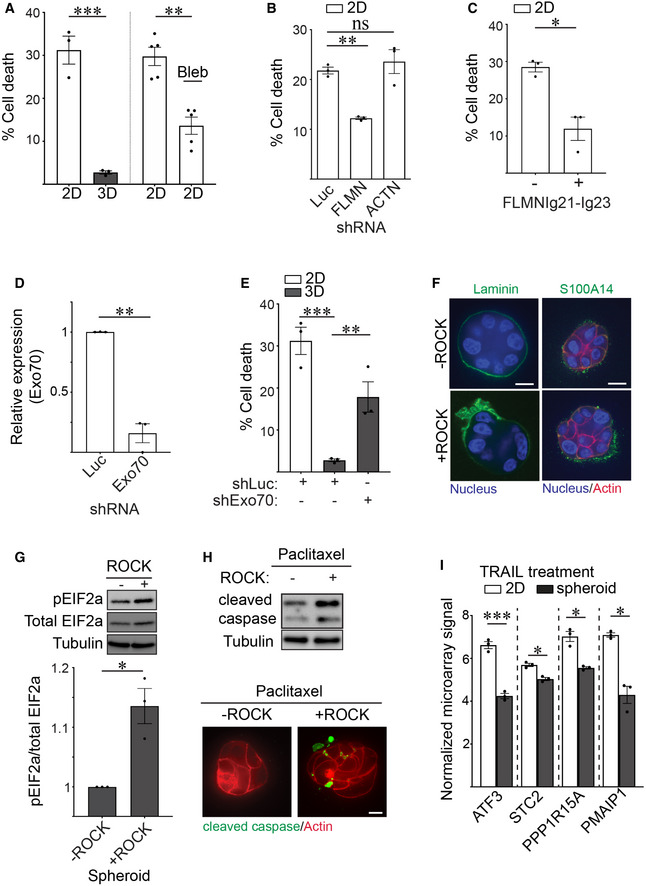
Figure 8. Cortical actin tension regulates MEC spheroid phenotype.

-
AGraph of the percent cell death measured in MCF10A MECs ligated to rBM in 2D and 3D (left) and in 2D treated with blebbistatin (2D + Bleb) 48 h post‐plating (right) that was quantified using calcein AM and ethidium homodimer staining (mean ± SEM; 2D, n = 3; 3D, n = 3 independent experiments; 2D + DMSO, n = 5; 2D + Bleb, n = 5 independent experiments). 2D versus 3D, ***P = 0.0010, 2D versus 2D + Bleb, **P = 0.0248 (Student's t‐test).
-
BBar graph of the percent cell death measured in MCF10A MECs stably expressing shRNAs targeting Luciferase (Luc), filamin (FLMN) or actinin (ACTN) and ligated to rBM in 2D. Cell death was assessed at 48 h post‐plating via calcein AM and ethidium homodimer staining (mean ± SEM; n = 3 independent biological replicates). **P = 0.0034; ns = not significant (Student's t‐test).
-
CBar graph of the percent cell death in MCF10A MECs expressing luciferase control or filamin repeats 21–23 (FLMNIg21‐Ig23) that were ligated with rBM in 2D. Cell death was assessed at 48 h post‐plating via calcein AM and ethidium homodimer staining (mean ± SEM; n = 3 independent biological replicates). *P = 0.0489 (Student's t‐test).
-
DBar graph of the levels of endogenous Exo70 in MECs stably expressing shRNA against Exo70 or luciferase (Luc) (mean ± SEM; n = 3 independent biological replicates). **P = 0.0086.
-
EBar graph of the percent cell death measured in MECs expressing shRNA targeting Exo70 (shExo70) or luciferase (control) and ligated with rBM in 2D or 3D. Cell death was assessed at 48 h post‐plating via calcein AM and ethidium homodimer staining (mean ± SEM; n = 3 independent biological replicates). Statistical analysis by one‐way ANOVA followed by Uncorrected Fisher's LSD. 2D versus 3D, ***P = 0.0004. 3D + shLuc versus 3D + shExo70, **P = 0.0091.
-
FSpheroids were induced to express constitutively active ROCK or left uninduced (control) and co‐stained with antibodies for laminin or S100A14 (green), phalloidin (red) and DAPI (blue). Scale bar, 10 μm.
-
GRepresentative immunoblots of phosphorylated EIF2a (pEIF2a), total EIF2a and alpha‐tubulin in cell lysate from MCF10A MEC spheroids induced to express constitutively active ROCK or left uninduced (control). Corresponding quantification data are plotted at bottom (mean ± SEM; n = 3 independent biological replicates). *P = 0.0442 (Student's t test).
-
HSpheroids were induced to express constitutively active ROCK or left uninduced (control), treated with Paclitaxel (2 nM), lysed and immunoblotted for cleaved caspase‐3 and alpha‐tubulin (top). In parallel, spheroids were stained with antibody and phalloidin to evaluate the levels of caspase‐3 (green) and actin organization (red), respectively. Scale bar, 10 μm.
-
IBar graph of the relative mRNA levels of ER stress response genes including ATF3, STC2, PPP1R15A, and PMAIP1 in microarray analyses of TRAIL treated HMT‐3522 S‐1 MECs plated as monolayers on a rigid rBM (2D) or as spheroids (3D) (mean ± SEM; n = 3 independent experiments). ATF3, ***P = 0.0006; STC2, *P = 0.0353; PPP1R15A, *P = 0.0254; PMAIP1, *P = 0.0127 (Student's t‐test).
Source data are available online for this figure.
