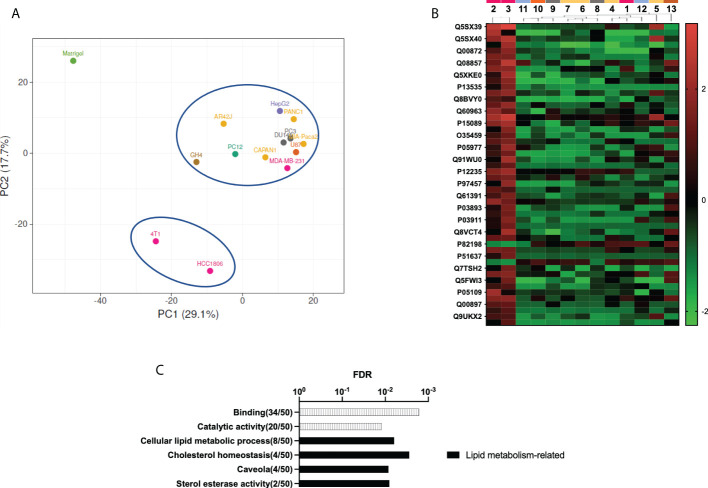
Figure 4.
Proteomic study shows distinctive ECM on decellularized TNBC xenograft samples. (A) Principal component analysis (PCA). Matrigel control samples are plotted separately from all tumor xenograft samples. Tumor xenograft samples come out splinted into two groups, with the two TNBC xenograft-derived samples separated from the rest of the samples. (B) Heat map representation of the 50 more discriminant proteins obtained by partial least squares discriminant analysis (PLS-DA). (C) GO analysis of the 50 more discriminant proteins. Note: cell line number codes are provided in Table 1 . The same tumor color codes are used in all panels of the figure.

