Figure 5.
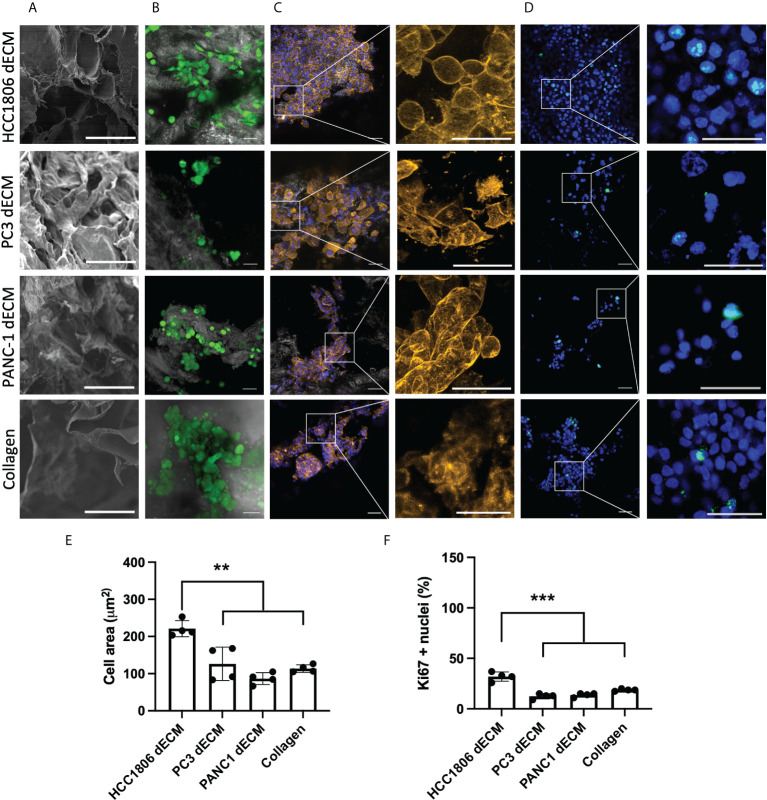
HC1806 cells show different cell behavior on HC1806 dECM compared to dECM from other tumor xenografts. (A) Detail of SEM imaging of samples showing surface structure (scale, 50 μm). (B-D) Images of cell-seeded samples. (B) Calcein-AM–positive cells are shown in green, while scaffold material is shown in grey (×20 (scale, 20 μm)). (C) Actin cytoskeleton immunostaining in orange; DAPI nuclear staining in blue (×10 (scale, 50 μm) and detailed images (scale, 20 μm)). (D) Ki67 immunostaining in green; DAPI nuclear staining in blue (×10 (scale, 20 μm) and detailed images (scale, 50 μm)). (E) Quantification of cell size (area) using actin cytoskeleton membrane distribution images. (F) Quantification of proliferative cells (Ki67-positive cells vs. total cells observed in each material). N = 3 in all cases and 2 areas measured per sample.

