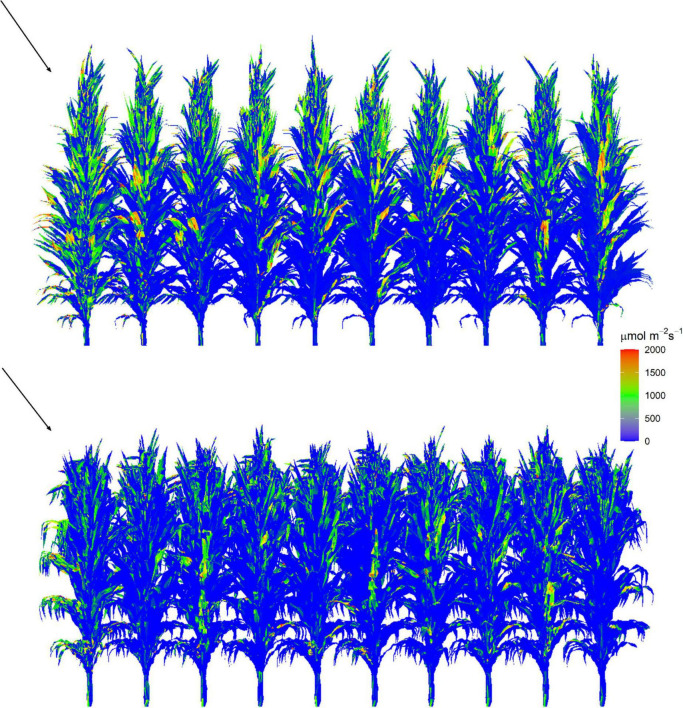
FIGURE 3.
Visualization of intercepted PAR by facets within reconstructed canopy at 12:00 on a clear day on August 1, 2019 for XY335 (top) and ZD958 (bottom) at the density of 7.5 plants m– 2. Each canopy is composed of 200 plants with 10 rows and 20 plants per row. Red triangles represent higher values and blue triangles represent lower values. The arrow indicates the illumination direction and the sun elevation angle is 68°.

