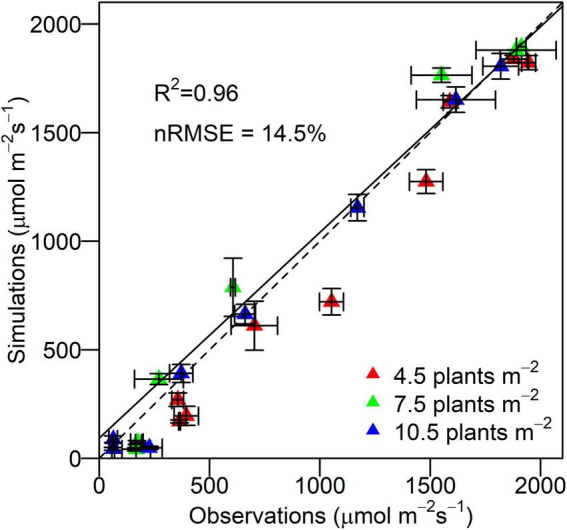
FIGURE 4.

Observations of irradiant PAR by quantum sensors and simulations of irradiant PAR by virtual line sensors in the 3D model at different canopy depths at the density of 4.5, 7.5, and 10.5 plants m– 2 for XY335. Error bars indicate the SE. The dashed line is the 1:1 line. The solid line is the regression line.
