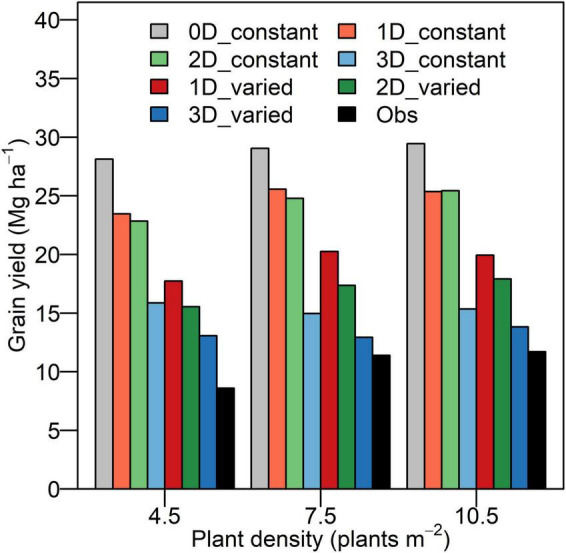
FIGURE 5.

Simulated grain yield potential and experimental yield at three densities (4.5, 7.5, and 10.5 plants m–2) for XY335. The 0D_constant represents the 0D model with a constant RUE. The 1D_constant, 2D_constant, and 3D_constant represent the 1D, 2D, and 3D models with uniform and constant photosynthetic capacity. The 1D_varied, 2D_varied, and 3D_varied represent the 1D, 2D, and 3D models with heterogeneous and varied photosynthetic capacity. The Obs represents the experimental yield.
