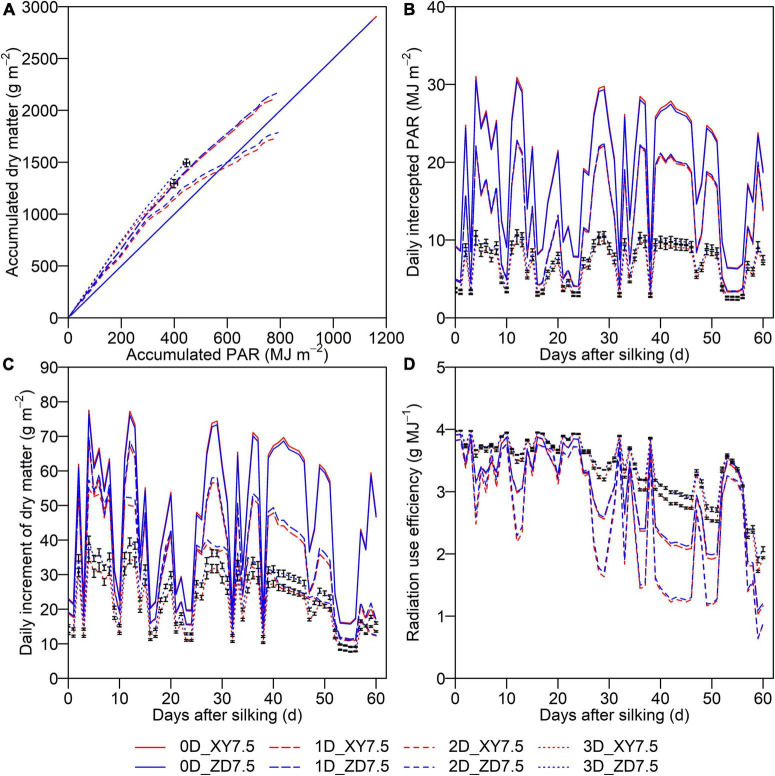
FIGURE 6.
Cumulative dry matter after silking as a function of accumulated PAR (A) and dynamics of daily intercepted PAR (B), daily increment of dry matter (C), and daily radiation use efficiency (D) during post-silking period. Solid lines denote the 0D model, longdash lines denote the 1D model, dashed lines denote the 2D model, and dotted lines denote the 3D model. Blue denotes ZD958 and red denotes XY335 at the density of 7.5 plants m–2. Error bars indicate the SE.

