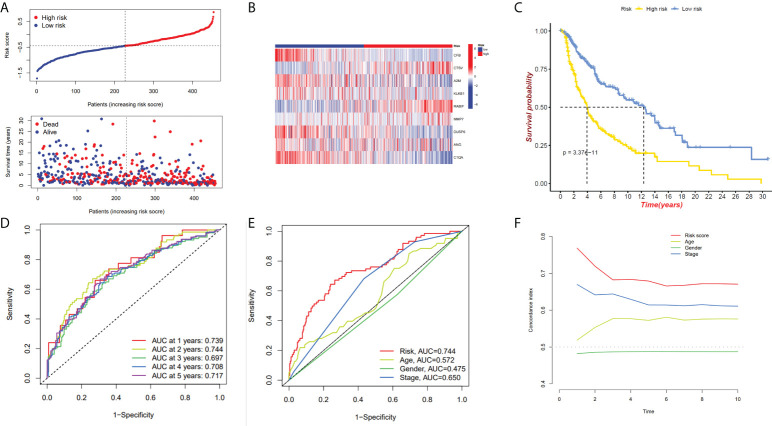
Figure 3.
The 7-gene model in the TCGA cohort prognostic analysis. (A, B) Risk score distribution and the relevant survival data and the TCGA cohort’s heat map of prognostic genes expression. (C) The Kaplan–Meier curve analysis of the TCGA cohort’s high and low-risk groups. (D) The AUCs under ROC curves for 1-, 3-, and 5-year OS predictions based on the risk model. (E) ROC relating risk scores with clinical indicators of pathology. (F) C-index comparison between risk score and clinical features (age, gender, and stage).

