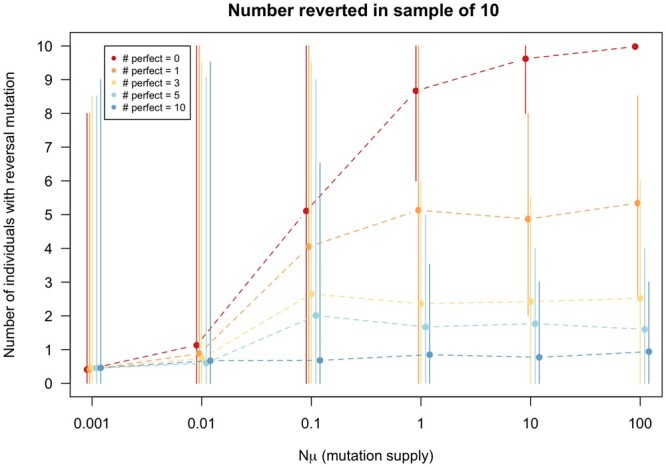
Fig. 5.

Simulations of evolution across mutation rates under different numbers of available fully compensatory mutations. The x-axis corresponds to ranges of mutation supply (), and the y-axis shows the number of sampled bacteria where reversion to the wild type occurred. Here, we observe that even the presence of a single fully compensatory mutation (dark orange line) greatly decreases the likelihood that the wild-type allele will arise. The simulations were run for 100 generations. Other parameters: . The error bars represent the 95% confidence interval (from the 2.5 percentile to the 97.5 percentile of the simulation runs).
