Fig. 1.
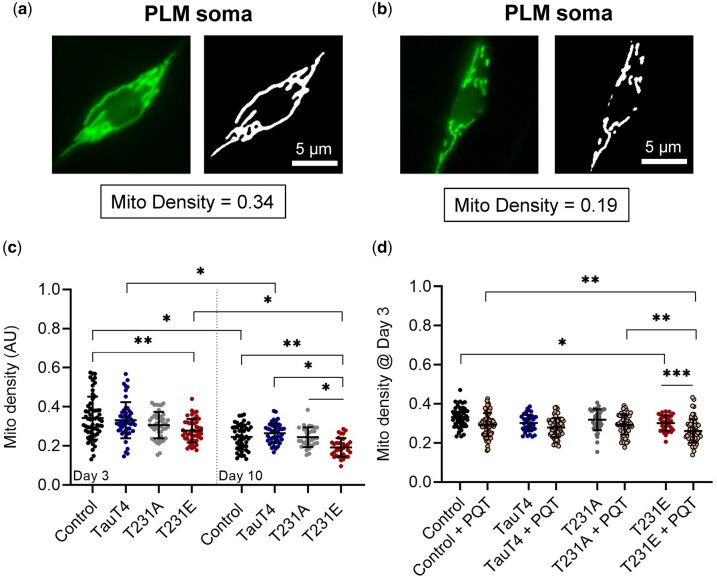
Mitochondrial morphology in PLM soma as a function of single-copy Tau mutants. An MLS::GFP reporter expressed via the mec-7 promoter was used to image mitochondria in the soma of PLM neurons. (a, b) Images on the left are the original fluorescent micrographs obtained from wild-type animals with mitochondrial networks that differ within the scope of our observations, representing natural variation and falling in the upper and lower quartile of the density metric, with values as shown. Images on the right represent a binary mask used to derive density. Scale bar: 5 µm. (c) Quantitative analysis of mitochondrial density at day 3 and 10 as a function of single-copy tau genotype. (d) Density as a function of 24 h treatment with 8 mM PQT starting at day 2 of adulthood. Data were collected via 3 independent biological replicates where all relevant genotypes were compared in parallel. Individual data points are values from single PLM cells from separate animals, with the mean ± SD plotted in the background (N = 33–71). Statistical analyses were 2-way ANOVA with Tukey’s multiple comparison test, with ***P < 0.001, **P < 0.01, *P < 0.05 when comparing bracketed samples.

