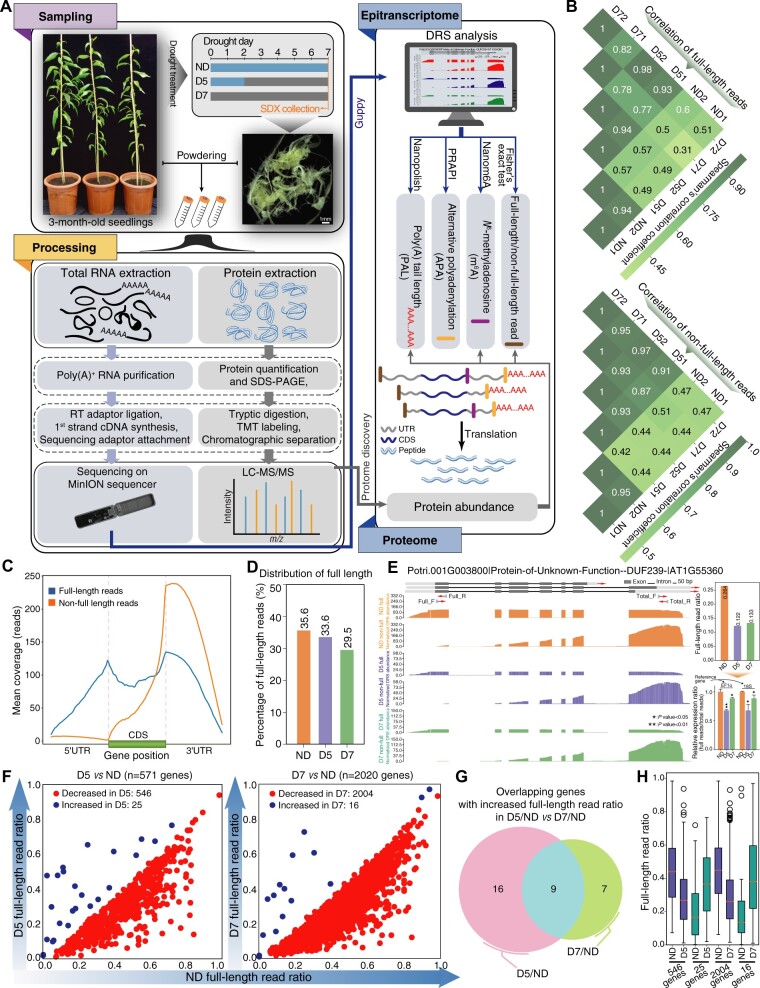
Figure 1.
Nanopore DRS of RNA from SDX subjected to drought stress. A, Flowchart for analysis of epitranscriptome and proteome changes triggered by drought stress using Nanopore DRS and TMT labeling. Nanopolish, PRAPI, and Nanom6A are three pipelines for analysis of long reads. B, Heatmap showing Spearman’s correlation among ND, D5, and D7 samples for full-length and nonfull-length reads. C, Coverage of full-length and nonfull-length reads along transcripts. D, Histogram showing the dynamics of the full-length read ratio during drought stress. E, Wiggle plot, histogram, and RT-qPCR showing decreased full-length read ratio of DUF239 upon drought treatment. Significant difference was evaluated by t test and presented with asterisk rating system (*P < 0.05; **P < 0.01). Total_F/Total_R and Full_F/Full_R are the primer positions. F, Scatter plot showing differential full-length ratios upon drought treatment. G, Venn diagram showing overlap of genes with increased full-length read ratio in D5 versus ND and D7 versus ND comparisons. H, Boxplot showing the ratio distribution for genes with differential full-length read ratios in ND, D5, and D7 samples. The box limits represent 25th and 75th percentiles; center line, 50th percentiles; and whiskers, 10th and 90th percentiles. The circle represents outlier value.

