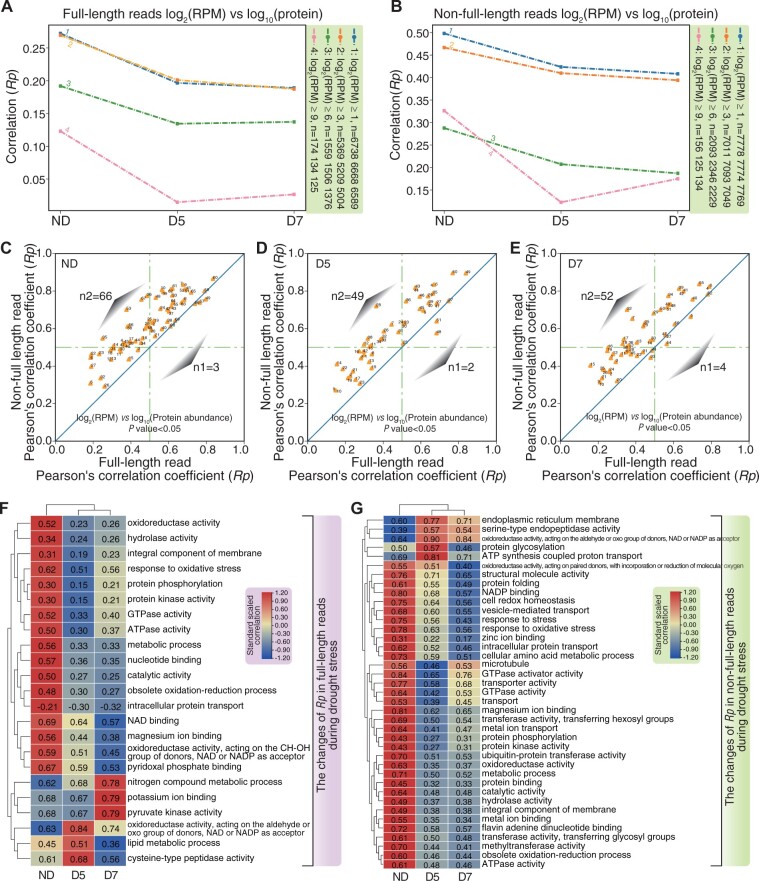
Figure 3.
Correlation between protein abundance and mRNA expression during drought stress. A\–B, Line plots of Rp with different RPM threshold levels for full-length (A) and nonfull-length RNA (B). C–E, Scatter plots showing different Rp based on GO terms between full-length RNA and nonfull-length RNA in ND (C), D5 (D), and D7 (E). F, Heatmap showing changes in Rp of full-length reads in response to drought treatment. The color of heatmpap (dark blue to red) indicates the correlation (low to high). G, Heatmap showing changes in Rp of nonfull-length reads in response to drought treatment.

