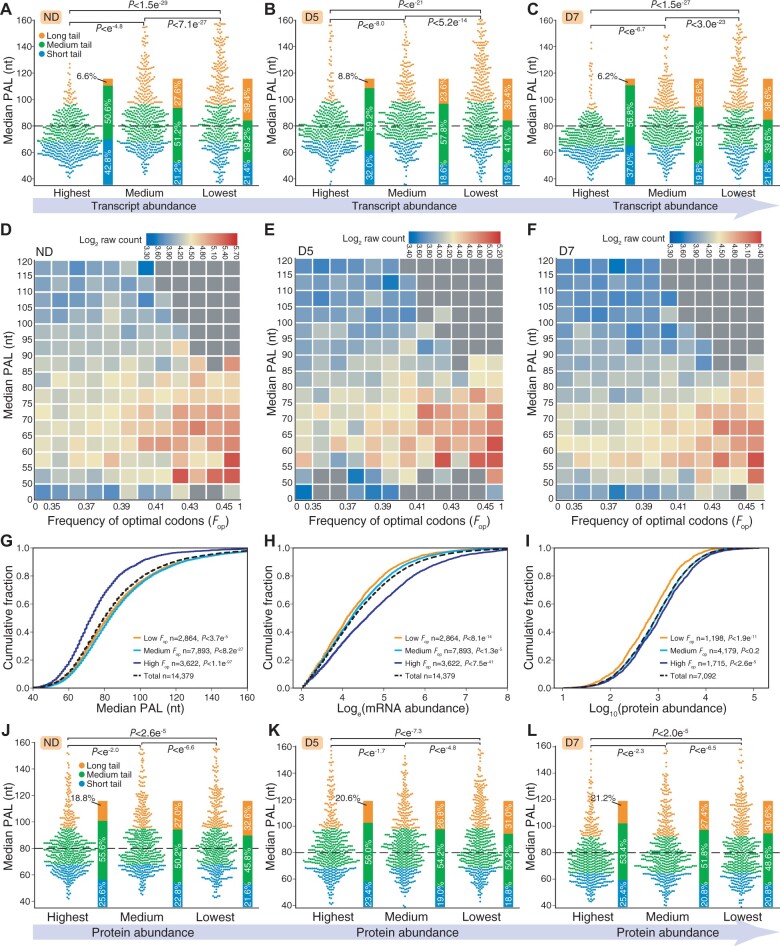
Figure 7.
Highly expressed transcripts tend to have a short PAL. A–C, PAL distribution of genes in pools with different expression levels in ND (A), D5 (B), and D7 (C). Highest, medium, and lowest represent the 500 most highly expressed genes, the 500 genes with closest to median expression, and the 500 genes with lowest expression, respectively. P-value was calculated by Mann–Whitney U rank test. D–F, Heat maps representing the association between the frequency of optimal codons (Fop) and PAL in ND (D), D5 (E), and D7 (F). G–I, Cumulative sum plots showing association of translational efficiency (codon optimization) with PAL (G), mRNA abundance (H), and protein abundance (I). J–L, PAL distribution of genes in pools with different protein levels in ND (J), D5 (K), and D7 (L). P-value was calculated by Mann–Whitney U rank test.

