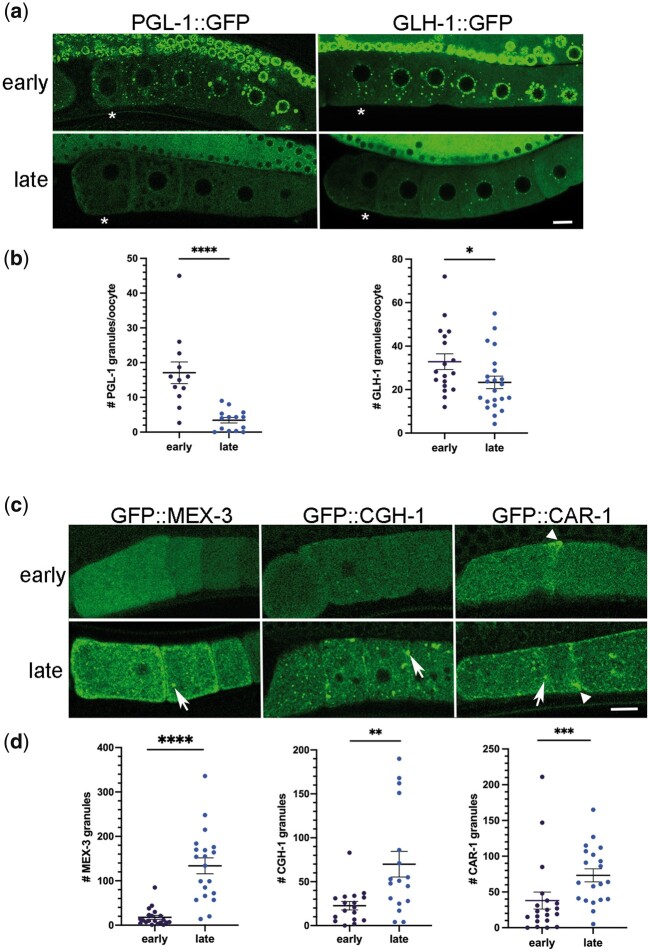
Fig. 2.
Imaging-associated stress causes distinct phase transitions among RNA-binding proteins. a) Micrographs of GFP-tagged P granule protein reporter strains, PGL-1::GFP and GLH-1::GFP. Top row: distribution of GFP in germ line early during imaging; bottom row: distribution of GFP in germ line after extended imaging (late) with strongest phenotypes shown. Asterisk marks the most proximal oocyte in each germ line. Smaller distal pachytene nuclei are visible at top of each image. Scale bar is 10 µm. b) Graphs showing the number of GFP granules in a single Z-slice of proximal oocytes (see Methods). Statistical significance was determined using the Mann–Whitney test. **** indicates P < 0.0001; * indicates P < 0.05. n = 16–26. c) Micrographs of GFP-tagged RNA-binding protein reporter strains (MEX-3, CGH-1, and CAR-1) in most proximal oocytes. Top row: distribution of GFP early during imaging; Bottom row: distribution of GFP after extended imaging (late) with strongest phenotypes shown. Arrows indicate ectopic granules; arrowheads indicate cortical enrichment. Scale bar is 10 µm. d) Graphs showing the number of GFP granules in a single Z-slice of proximal oocytes. Statistical significance was determined using the Mann–Whitney test. **** indicates P < 0.0001, *** indicates P < 0.001, and ** indicates P < 0.01. n = 17–20. Error bars indicate mean ± SEM.

