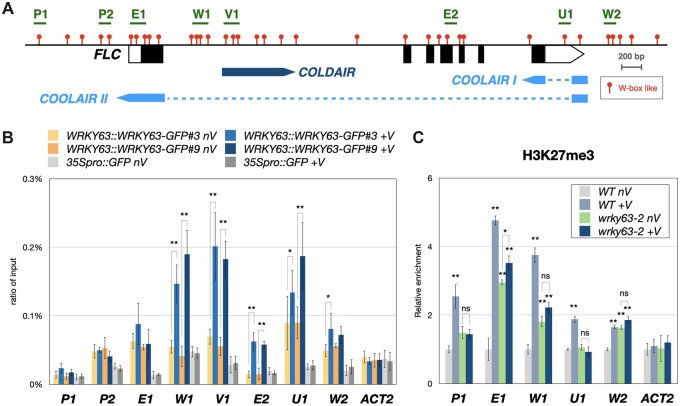
Figure 5.
Binding of WRKY63 and the H3K27me3 level on the FLC locus in vivo. A, The schematic structure of the FLC genome. The blocks represent transcribed regions of FLC, COLDAIR and COOLAIR. The dashed lines indicate intron regions. B, Binding of WRKY63pro::WRKY63:GFP to FLC identified by ChIP-qPCR assays. Fourteen-day-old WRKY63pro::WRKY63:GFP transgenic plants without vernalization (nV) or with 4 weeks of vernalization (+V) were used for ChIP assays using an anti-GFP antibody. The 35Spro::GFP transgenic plants were used as a control. The amount of immunoprecipitated DNA was quantified by qPCR. Values represent the average immunoprecipitation efficiencies (%) against the total input DNA, and ACT2 was used as a negative control. C, ChIP analysis of H3K27me3 levels on the FLC locus. Plants without vernalization (nV) or with 4 weeks of vernalization (+V) were used for ChIP assays. The amounts of DNA after ChIP were quantified by qPCR and normalized to TA3. Error bars indicate sd from three biological replicates. *P < 0.01, **P < 0.001, ns: no significant difference (Student’s t test).

