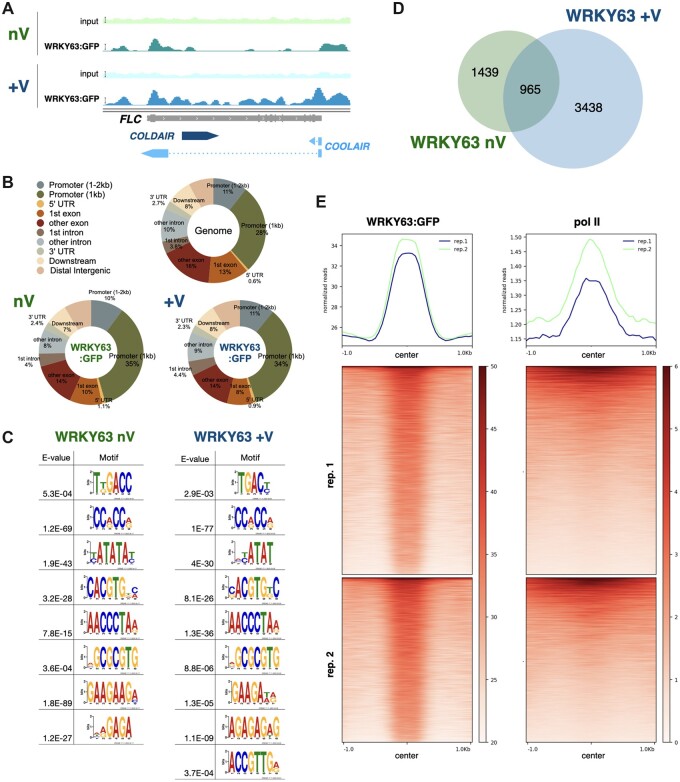
Figure 6.
Genome-wide occupancy profiles of WRKY63. A, IGV showing the binding of WRKY63 on the FLC locus without (nV) or with (+V) vernalization. Bars: normalized reads = 25. B, Pie charts showing the distribution of WRKY63 annotated genic and intergenic regions in the genome. C, The DNA binding motifs significantly enriched in the WRKY63 binding sites. D, A Venn diagram showing the overlap between WRKY63 targeted genes among vernalization (WRKY63 +V) and non-vernalization (WRKY63 nV) treatments. E, Heat map representation of the occupancy of WRKY63 and RNA polymerase II (pol II) in the WRKY63 occupied genomic region. Each horizontal line represents a WRKY63 binding region, and the signal intensity is shown for the occupancy of WRKY63 and pol II (center). Columns show the genomic region surrounding each WRKY63 peak. Signal intensity is indicated by the shade of heatmap.

