Figure 7.
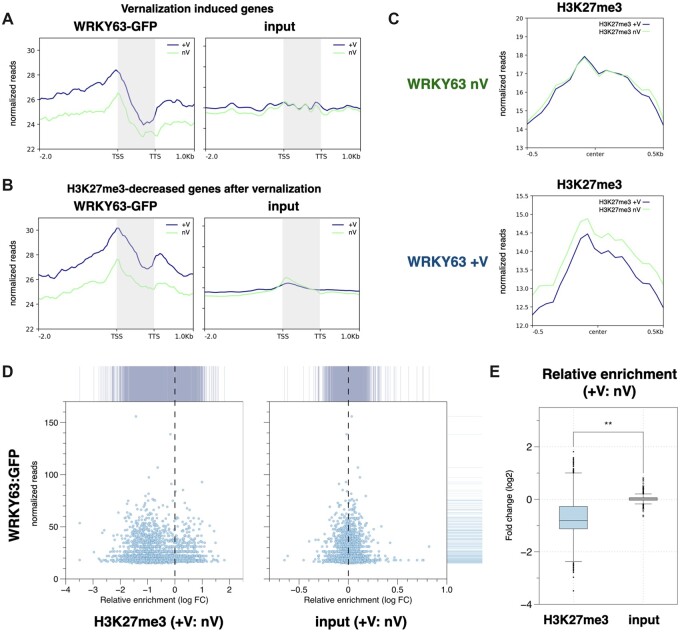
WRKY63 is associated with vernalization-induced gene activation and H3K27me3 demethylation. A and B, Metagene ChIP-seq binding profiles of WRKY63 among the vernalization-induced genes (A) and the H3K27me3-decreased genes after vernalization (B). The profile is from 2-kb upstream of the TSS to 1-kb downstream of the TTS, and the gene lengths were scaled to the same size. C, The mean density of H3K27me3 enrichment in the WRKY63 occupied regions under non-vernalization (WRKY63 nV) or vernalization (WRKY63 +V) treatments. The average H3K27me3 signal under vernalization (H3K27me3 +V) or non-vernalization (H3K27me3 nV) within 0.5-kb genomic regions flanking the center of WRKY63 peaks is shown. D, X–Y scatter plots showing the relative enrichment of H3K27me3 levels (+V: nV) and the binding level of WRKY63 under vernalization with the vernalization-specific WRKY63 targeted genes. E, Boxplot showing the relative H3K27me3 level (+V: nV) of the vernalization-specific WRKY63 targeted genes. Center line: median value; box limits: central 50% of the data, upper/lower quartiles: first/last 25% of the data; points: value of the outliers. **P < 0.001 (Student’s t test).

