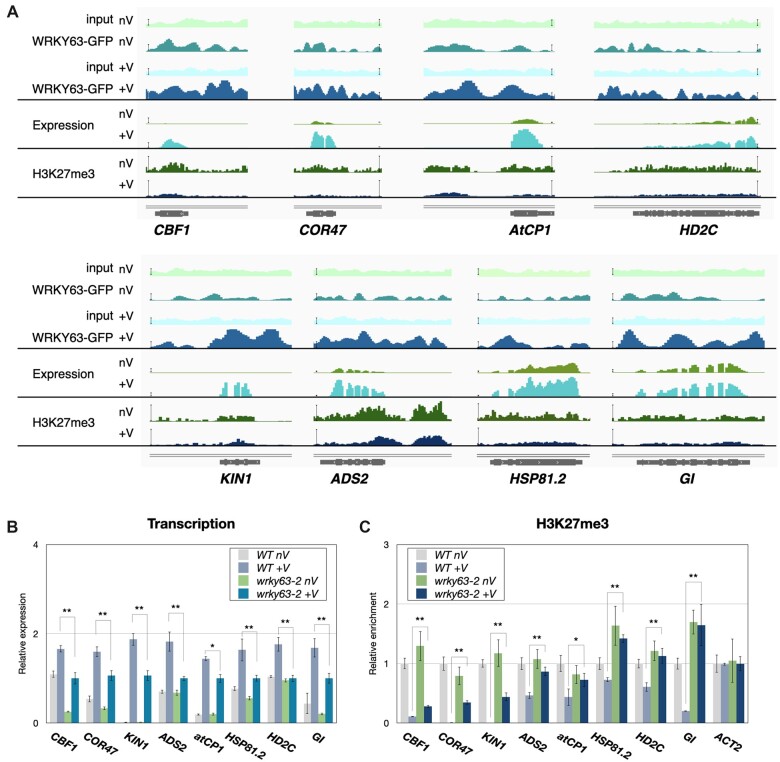
Figure 8.
The WRKY63 binding, expression and H3K27me3 level of WRKY63 regulated genes. A, IGV showing the WRKY63 binding, expression, and H3K27me3 level of selected genes. Bars: normalized reads = 25. B and C, Expression (B) and H3K27me3 patterns (C) in WT and wrky63 mutants. Expression of the indicated genes was analyzed by RT-qPCR. UBQ10 was used as an internal control. ChIP assays were performed with the H3K27me3 antibody. The amounts of DNA after ChIP were quantified by qPCR and normalized to TA3. Error bars correspond to standard derivations. *P < 0.05; **P < 0.005 (Student’s t test). At least three independent biological replicates were performed with similar results.

